After the S&P500 and the DJIA, the Nasdaq Composite Index (^IXIC) is the third most commonly quoted US index.
Unlike its blue chip-focused peers, the ^IXIC provides a snapshot of the common equity market.
It covers securities such as ETFs, real estate investment trusts, American depositary receipts, non-blue chip stocks, limited partnership interests etc.
As such, it is safe to say that ^IXIC offers exposure to the rank-and-file of the US markets. Its composition is heavily slanted towards information technology companies, of which there are indeed many in the above defined category.
The broad-based nature of the index is also evident in the fact that it includes companies that are not US-based.
How does ^IXIC work?
The Nasdaq Composite Index is a market cap weighted one. What this means is that stock-price swings of companies with larger market caps have a bigger impact on the overall index value. Given the enormous pool of constituents however, no individual company can induce spectacular swings in the ^IXIC value by itself.
The Nasdaq Composite Index has seen a number of spectacular downturns through its existence.
Launched in 1971, it started off a base value of 100. Despite occasional setbacks, it steadily climbed, reaching the 1,000 level on July 17, 1995.
The index reached its all-time high of 5,132.52 on March 10,2000. This peak coincided with the peak of the dot com bubble.
Subsequently, as the bubble burst, the index dropped. At one point, it had shed some 78% of its peak value.
Nowadays, the ^IXIC’s value is most definitely on the mend, although it still has some ways to go before rebounding to its ATH.
How is the Nasdaq Composite Index calculated?
The share weights of the constituents are multiplied by the last price of each security, and then added up. The result is then divided by an index divisor, with the goal of turning the number into a more manageable one.
The index value is updated every second. It is however calculated continuously throughout the trading day.
The last value of the day is made public at 4:26 PM.
There are two Nasdaq Composite Index versions: the total return one and the price return one. The total return version takes reinvested dividends into account, unlike the price return one.
^IXIC’s constituent pool is adjusted throughout the year. As soon as a security is found to not fulfill the eligibility requirements, it is dropped and replaced with a new one.
To be eligible, a security needs to be listed exclusively on the Nasdaq Stock Market, and it needs to be of the type mentioned above. If it does not fit the said categories, the security does not qualify for ^IXIC.
^IXIC’s composition
As mentioned, the composition of the Nasdaq Composite Index is heavily information technology-leaning.
In fact, some 46.40% of the featured securities are technology ones. Consumer services are also heavily represented at 20.16%. Health care is third, with 10.86%, followed by financials with 8.59% and industrials at 6.32%.
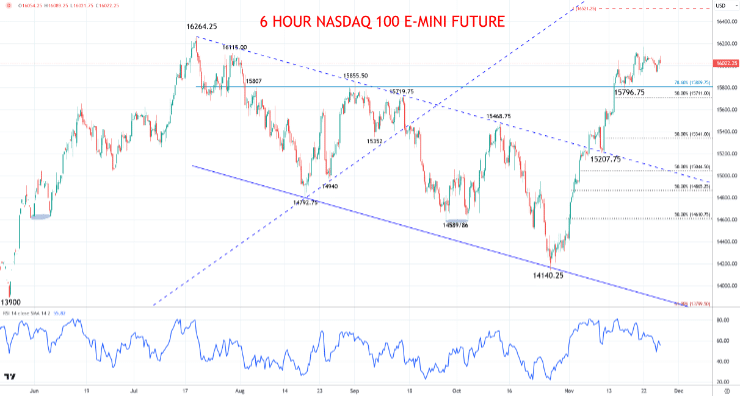
Nasdaq 100 December 2023 E-Mini Futures Contract
A Monday Doji, to retain consolidation under last week’s high at 16173.50, to sustain positive forces from the early-November rebound from 15207.75, against the July channel-top and melt-up past a series of resistances (15719.75, 15809.75 and 15855.50), to sustain the late-October surge, setting a trend low at 14140.25, to retain a bullish threat for Monday.
Day trade setup
- We see an upside bias above 16115.00 for 16173.50; breakout targets 16226.25, 16264.25 and 16521.25.
- However, below 15809.75 targets 15711.00; break here aims for 15612.75, 15465.25 and 15341.00.
Nasdaq Index Calendar
11/29/2023 EU Consumer Confidence; German CPI; US GDP and PCE (QoQ)
11/30/2023 Chinese PMI; German Retail Sales; German Unemployment; EU CPI; US PCE (MoM and YoY); Canadian GDP; OPEC+ Meeting
12/01/2023 Global PMI from S&P Global; US ISM PMI; Fed Chair Powell speaks
View Full Calendar