Individual Stock Investing
The first question to be asked; yet is often overlooked for fear of appearing naïve is:
“What do we mean by ‘A Stock’ ?”
A stock, which can also be called an equity or share, is a financial asset or security representing a specific proportion of the issuing corporation.
In effect owing a stock provides the purchaser with a share in the performance of the stock issuing company. As such one may be entitled to a share in the proportion of profit, after all taxes and other obligations have been paid, that the company’s board decide to distribute as “Dividends” rather than keep within the company as “Retained Earnings”.
These are financial institutions whose assets are mainly investing in stocks, bought on stock markets, exchange traded fund markets and sold on a stock exchange investment platform, such as online brokers one will hear mentioned in financial news. Indeed, many major cities are home to a top stock market, exchange diversified investment,, brokerage firm or financial advisors, the most famous being:
New York City… London…Paris…Frankfurt…Milan…Mumbai…Seoul…Shanghai…Tokyo…Sydney
Be it on a “trading floor” or by electronic screen, the stock market or stock exchange is literally the venue where individual stocks, are exchanged for cash or other individual stocks themselves, subject to stringent regulations that protect all parties from financial malpractice.
Now we have identified what the individual stocks are, the second question is
“Why are they issued?”
Imagine an individual has a good idea for a product that will meet a need, or gap in the stock market itself. They may start a business or start investing in stocks, with the own money saved in taxable brokerage account and money invested from their brokerage account, own savings or an other investment account, individual retirement account, or brokerage account, or borrow funds and act alone as a “Sole Trader” or “Sole Proprietor” where they enjoy full control of the stock investing enterprise and its operation.
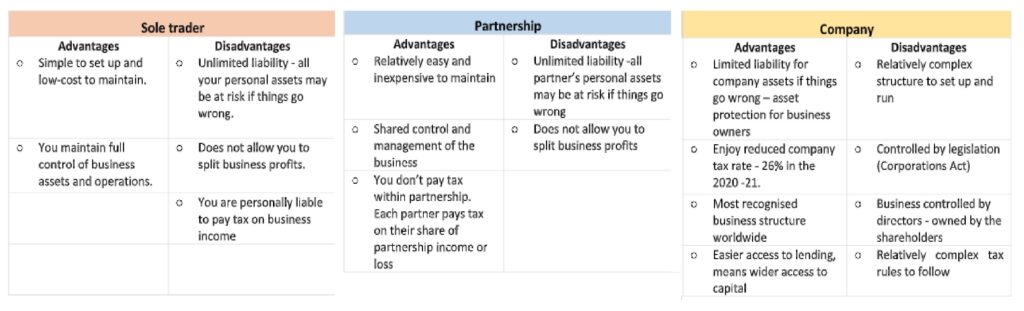
Therefore, a sole proprietorship is an unincorporated business that one person owns and manages. The business and the owner are not legally separate entities and as such this represents the simplest form of business structure. Indeed individual entrepreneurship usually conducted under the founders own name; however, business can also be conducted under a registered trade name.
Consider the U.K. chemist/pharmacist “Boots” was established in 1849, by John Boot and “Virgin”, opened as a discounted record store on Oxford Street, London by Richard Branson.
At this scale of business there are relatively few tax rules, although complete financial records must be kept and filed so that the appropriate level of tax is paid by the sole trader as an individual. There is the advantage of full managerial control and after tax and expenses profits all accrue to the owner.
However, given there is no legal separation between the owner and the business, the responsibility for all debts and obligations rest with the sole trader.
That implies, that should the business fail to ever generate income of sufficient income to honour its obligations the creditors can seek to pursue the proprietor of the brokerage firm’s personal assets in order to be repaid.
If the individual investing in stocks and shares is successful with other investments and/or wishes to raise money from the stock market investment or the stock markets for own investments, to expand their own investments, they may seek to form an alliance with a like-minded individual to pool the talents and resources and so a “Partnership” is formed. Of course, partners may establish a company together, e.g. “Apple” co-founders Steve Wozniak and Steve Jobs met when they were young and realised that they had a shared passion for electronics.
The control will depend on how the interest in the partnership is split. The key difference between a general partnership and a limited partnership is that the general partners have full operational control of a business and unlimited liability as we saw with the sole proprietor. In contrast, limited partners have less liability and do not take part in day-to-day business operations.
Further expansion of the business enterprise may well require greater capital and investment goals so forming a “Limited Company” may prove to be the most sensible tax efficient course to follow.
A limited company is a legal entity and therefore can have debts and property in the company’s name, rather than that of the owner. So, the company will be liable for its debts.
Quite often interest rates and the tax rate applicable to limited companies and mutual and some exchange traded funds and index funds, are favorable cf. those a sole trader faces and limited companies, exchange traded funds and index funds are able to claim a greater number of allowable expenses, less trading fees so reducing the tax bill and investment portfolio is even further.
OK…but tell me about stocks and shares!
Given a limited company is its own incorporated legal entity, it can, depending on its outlook and credit score or rating secure greater business loans than is the case for a sole trader. This is because the loan is to the company and backed by the assets.
However, arguably the key reason is that a limited company is formed is because it can issue shares to be listed and traded on the same stock exchange or market investing sell shares on the appropriate stock market investments or exchange. This means that shares can be sold in the company and offer investors a “share” in the fortunes financial success of the company.
Shares come in different classes although most companies only ever have one type of share. The shares are commonly called “Ordinary Shares” and are the ones the company was incorporated with. Typical rights that go with ordinary shares are that each share is entitled to one vote and that a few shares has equal rights to pay dividends. Each share is entitled to participate in a distribution if the company were to be wound up.
Some companies, however, choose to have two or more different types of shares sometimes referred to as “Alphabet Shares”. In some companies these will be identified as “Ordinary A Shares”, “Ordinary B Shares” etc. with identical rights are issued to different shareholders.
This can allow dividends from stock portfolio of mutual funds to be paid to some shareholders of stock investing who invest in stocks of diversified portfolio of mutual funds but not to others so long as there is no infringement of the rules from the financial regular and/or tax authority on mutual funds.
In this article the focus will be on ordinary shares that carry voting rights on company strategy. In return for the capital gains tax the injection the shares isa original owners are diluting their level of control.
However, for the reader may wish to read further to learn about:
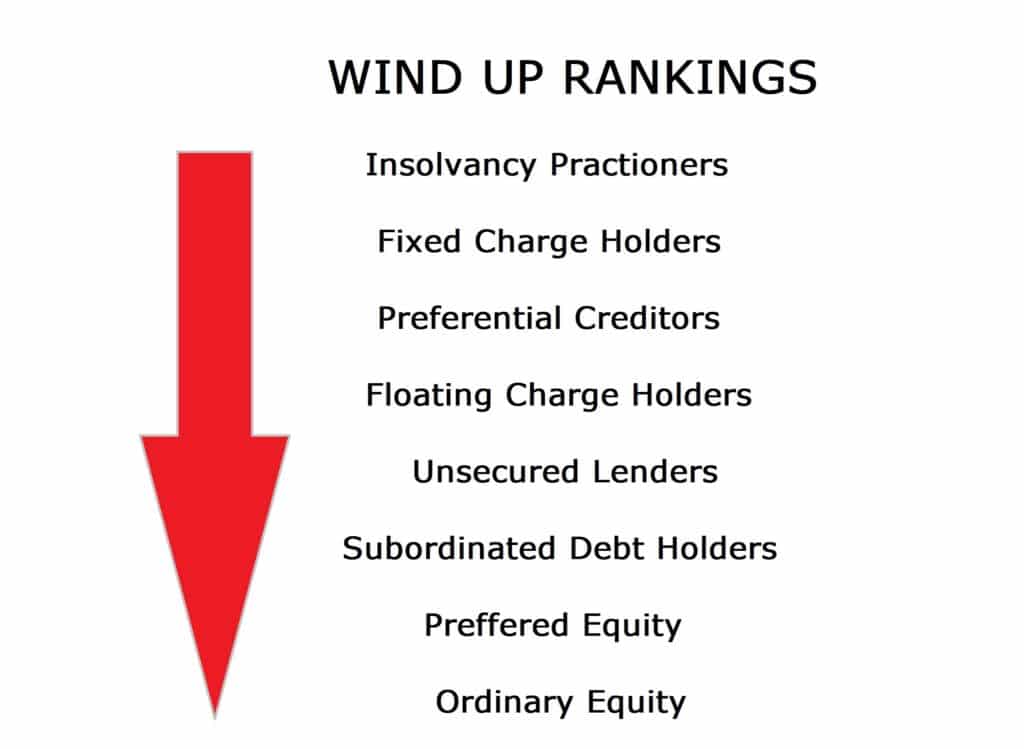
Non-Voting Ordinaries, Redeemable Shares, Preference Shares, Cumulative Preference Shares and Redeemable Preference Shares. It is also important to realise that ordinary shares will rank at the bottom of the pecking order in the case of the company being wound up as it ceases operations.
The Difference Between Trading Shares and Investing In Shares
Two terms that are often (mistakenly) used as being interchangeable are “Trading” and “Investing”.
Let it be clearly understood, they are not the same.
- The objective of TRADING is to generate profit in the Short-Term
- The objective of INVESTING is to build wealth in the Medium to Long-Term
Trading:
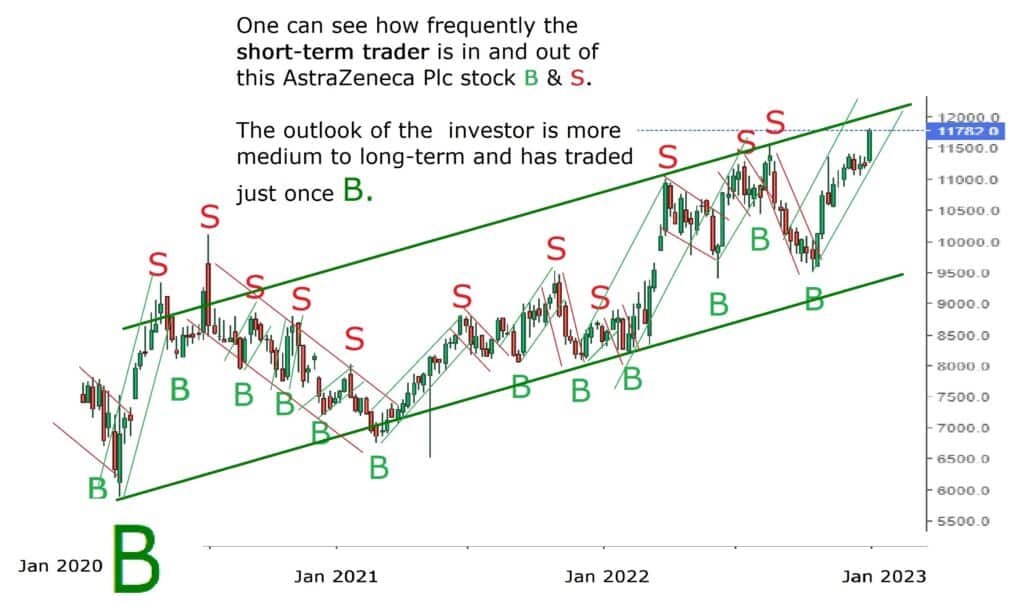
Trading is a proactive, short-term-focused investment strategy that requires a high level of attention to even the smallest shift in stock market sentiment. Look how frequently the trader has bought and sold AstraZeneca Plc in Figure 1 above.
It will naturally have to follow the broad macro direction of economic or specific industrial data, e.g. GDP Growth, Consumer Confidence, Retail Sales. However, the focus will be more micro as stock specific news may have an immediate impact on the company’s share price.
As an example on December 19, 2022, AstraZeneca (AZN, London) stock slipped 0.20% in morning trading, after the U.K.-Swedish pharma company said its “Imfinzi ©” drug had failed to reach primary endpoints in the latest of a series of trials scoping out its effectiveness.
As traders tend to hold assets for a much shorter period of time than investors with the aim of profiting from short-term share price movements. So, that news item would have been enough to persuade traders that this negative news would depress the share price. This was a short-term impact as one can see from the following piece of closing price data, share prices already from Friday had fallen so sentiment was already cautious.
Date Closing Price % Change
Friday, December 16 2022 11,156.0 -1.80%
Monday, December 19 2022 11,108.0 NEWS DAY -0.43%
Tuesday, December 20 2022 11,126.0 +0.16%
Wednesday, December 21 2022 11,244.0 +1.06%
One can see that traders will start investing focus on which direction the stock market price is likely to move next, invest in stocks for the short-term and seek to sell shares to profit from that price movement. In the example above, as the bad news about AstraZeneca Plc was absorbed into the stock market, traders started to think the sell-off in deal shares was complete and began either selling shares and losing money or acquiring cheaper stock or how to invest in stocks again in anticipation of a price recovery.
Trading Approach:
There is no single approach, investment goals, personal advice, financial advisor or investment objectives that one should adopt when trading and one can go long or short. Indeed many different strategies to seek financial advice, personal finance and investment advice exist, e.g.:
- Day trading… involves opening and closing positions within a single day. Closing a trade before the market closes reduces the risks of receiving unfavourable overnight news when one cannot act in the market
- High Frequency Trading… is a complex algorithmic driven strategy where a large number of orders are submitted and executed in fractions of a second. It adds momentary liquidity and leads to large firms domination
- Position Trading… the objective is to exploit the prevailing price trend
- Scalping… looks to capture small profits, repeatedly. It involves holding a position for a short amount of time, i.e. seconds or minutes
- Social Trading… is permitted on certain platforms . It will allow an individual to follow the trades of more experienced traders with a view to replicating their play
- Swing Trading… this can be almost where trading can see investment on the horizon as the focus is on larger price movements as positions may be held for several days or even weeks
Investment:
An investment manager is not looking to engage or show how to either invest in stocks or lose money in individual stocks either through rapid or relatively high frequency trading. Instead they are looking at the major macroeconomic trends, geopolitical developments as well as sector and company specific news. The constant question is how the data impact will make investment decisions and the ability of companies to pay their bills and of course, dividends. Typically, they are only looking to be long or flat of a stock.
Economics is the channel through which the “Big Picture” mood of the moment can be measured. Economic theory can be used to build asset models to learn how the prices of financial securities are determined and how these asset classes’ share prices may reflect time preferences, uncertainty and risk tolerance.
The key macroeconomic data points that an investor will follow are:
- GDP and GDP Growth Rates
- Fiscal Policy From The Government
- Inflation
- Monetary Policy From The Central Bank
- Sentiment…Both Consumer and Business
- Unemployment Rates
Note, these metrics move in and out of favour…one may want to invest in individual stocks or to look and Trade or Government Debt.
Look at the mood in the markets on Friday, January 6th 2023.
“…US stocks closed sharply higher on Friday, lifting major equity indices enough to book strong weekly gains after a batch of economic data drove investors to ease expectations of aggressive monetary tightening by the Federal Reserve. [D, C and E]
US wage growth unexpectedly slowed in December and values from prior months were revised sharply lower. [C driving E]
To add, ISM data showed that non-manufacturing business activity declined, while factory orders contracted well above expectations. [E driving A]
Still, the jobs report showed that the US economy added more jobs than expected for the ninth consecutive month, adding to evidence of stubborn tightness in the US labor market. [F driving A, B and C]
The Dow Jones added 700 points and the S&P 500 gained 2.3%, both notching gains of 1.4% on the first week of the year. In the meantime, the Nasdaq 100 outperformed and gained 2.8% in the session, rebounding after the hawkish signals from FOMC minutes [D] as 10-year Treasury yields retreated 15bps. [B] …”
Notice, all points are mentioned either explicitly or implicitly and there is reference to the bond and stock market both.
Why and how to invest in stocks and bonds? An equity investment or brokerage account, stock mutual funds or fund manager will need to be aware of the signals the bond and stock market investing itself is sending as bond spreads and the shape of the yield curve are good predictors of the economy. Similarly investing in both stocks and shares, clients of an investment, brokerage account or wealth manager may well wish to discuss their current asset allocation between stocks and shares, bonds and cash with financial adviser.
How Does An Investment Manager Value A Stock?
A well-used metric to value a stock is to compute the company’s Price-Earnings (P/E) ratio.
The P/E ratio equals the company’s last stock market price divided by its most recently reported Earnings Per Share (EPS, see below). A low P/E ratio implies that an investor buying the same stock mutual in index stock mutual funds is receiving an attractive amount of value. TTM PE is the stock index mutual funds’ current share price divided by the index stock mutual index funds’ last 4 quarterly EPS readings.
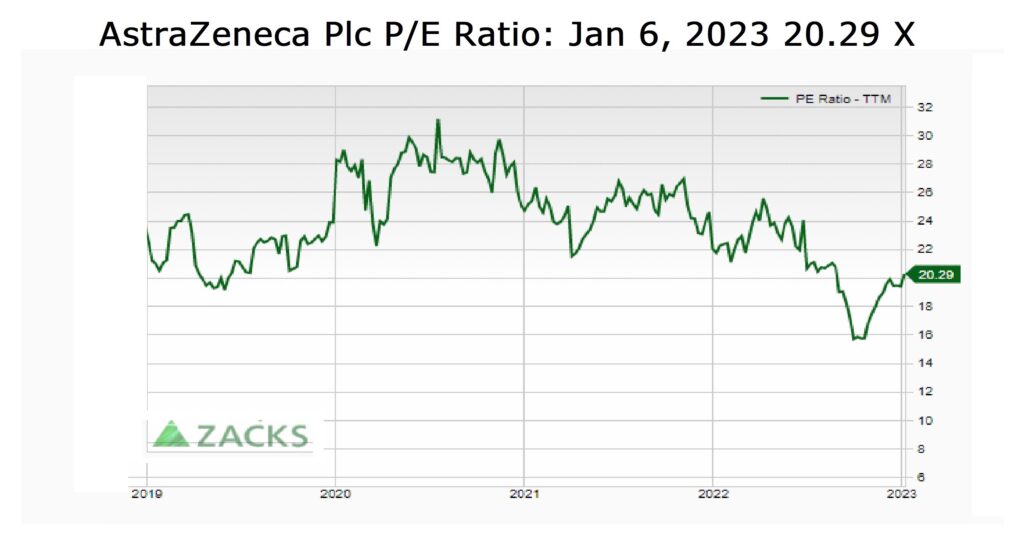
In the case of AstraZeneca Plc the P/E ratio (trailing 12-months or TTM) was 20.29 X on Friday, January 6, 2023.
This figure on its own is of little use, for how can we say if 20.29 X is good or bad cf. the broader peer group? The Large-Cap Pharmaceuticals Industry P/E is 14.84 X. One could argue that as AstraZeneca Plc is trading at a price that is 20 times greater than its twelve month earnings it is relatively expensive.
However, before one can state that as a certainty one must consider a whole stock market’s intrinsic value derived from business fundamentals. This is not always equal to the risk tolerance of current stock market or price. (So how much risk is for the efficient stock market, hypothesis then!)
Investment managers and index funds are paid to outperform, or at least match an underlying index, so whilst they are not aggressive day traders…far from it, they will be more active than just a simple passive player or an index mutual fund, or stock index mutual fund back-tracker.
Thinking back to our P/E example…what is a fair number? The answer is that it is different for different investors.
“Value” investors prefer low P/E ratios as the valuation implied by the stock market, price is substantially below its intrinsic value.
In contrast “Growth” investors are more likely to buy a stock with a high P/E ratio as they perceive a superior rate of earnings growth versus the absolute value of the earnings is sufficient to justify the higher P/E ratio.
They may place a greater store by the Price/Earnings to Growth (PEG) Ratio which for AstraZeneca PLC is 1.36 X compared to the Large Cap Pharmaceuticals Industry’s PEG ratio of 1.70 X.
The company’s trailing twelve month (TTM) PEG ratio is the P/E ratio divided by its growth rate over the past 12 months. This ratio essentially compares the P/E to its growth rate, thus, for many, telling a more complete story than just the P/E ratio alone.
In this vein another common metric used to value stocks centred around price is the price/sales (P/S) ratio. The P/S ratio is equal to a company’s market capitalisation, the total value of all outstanding shares divided by its annual revenue. For AstraZeneca Plc this stands at 4.89 X cf. Large-Cap Pharmaceuticals Industry P/S of 4.38 X.
“Earnings Per Share” (EPS) is a company’s net profit divided by the number of common shares it has outstanding. The EPS is an indicator of a company’s profitability. It is common for a company to report EPS that is adjusted for extraordinary or one-off items and potential share dilution.
Investors will compare EPS with the share price of the stock to determine the value of earnings and how investors feel about future growth. The higher a company’s EPS, the more profitable it is considered to be. For AstraZeneca Plc from the Q3 2022 statement the Diluted EPS was 0.53 up from -0.42 at the end of Q2 2022. The average over the last 5-Years has been 0.7529.
All Industrial Group averages were sourced from The New York University Leonard N. Stern School of Business, the Business School of New York University.
Understanding the Financial Statements and Releases:
Note this is not a full explanation of the Financial Statements
Companies are required by law to publish a summary of their finances every year. These publications are called their annual accounts. They reveal more about a company’s finances than any other public source, however, the quarterly statement will also be closely followed as will the future guidance.
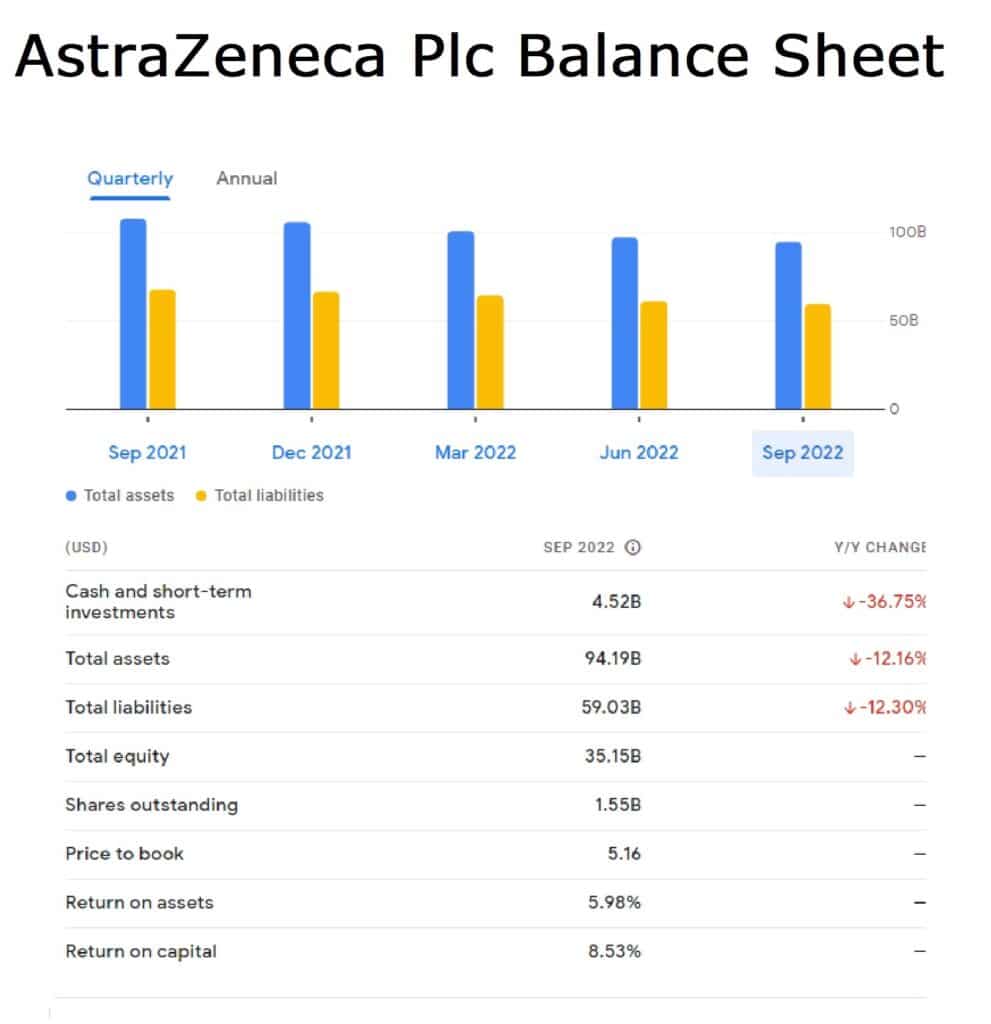
The “Balance Sheet” is the central document of a company’s accounts and all other statements relate to it. In short, it’s a table showing a company’s fixed ( > 12-months) and current assets </= 12-months), non-current and current liabilities and shareholder’s equity on a particular day, and their value. The value of the shareholder’s equity (i.e. the amount that the owners of a company have invested in their business) and it is the difference between the value of its assets and its liabilities.
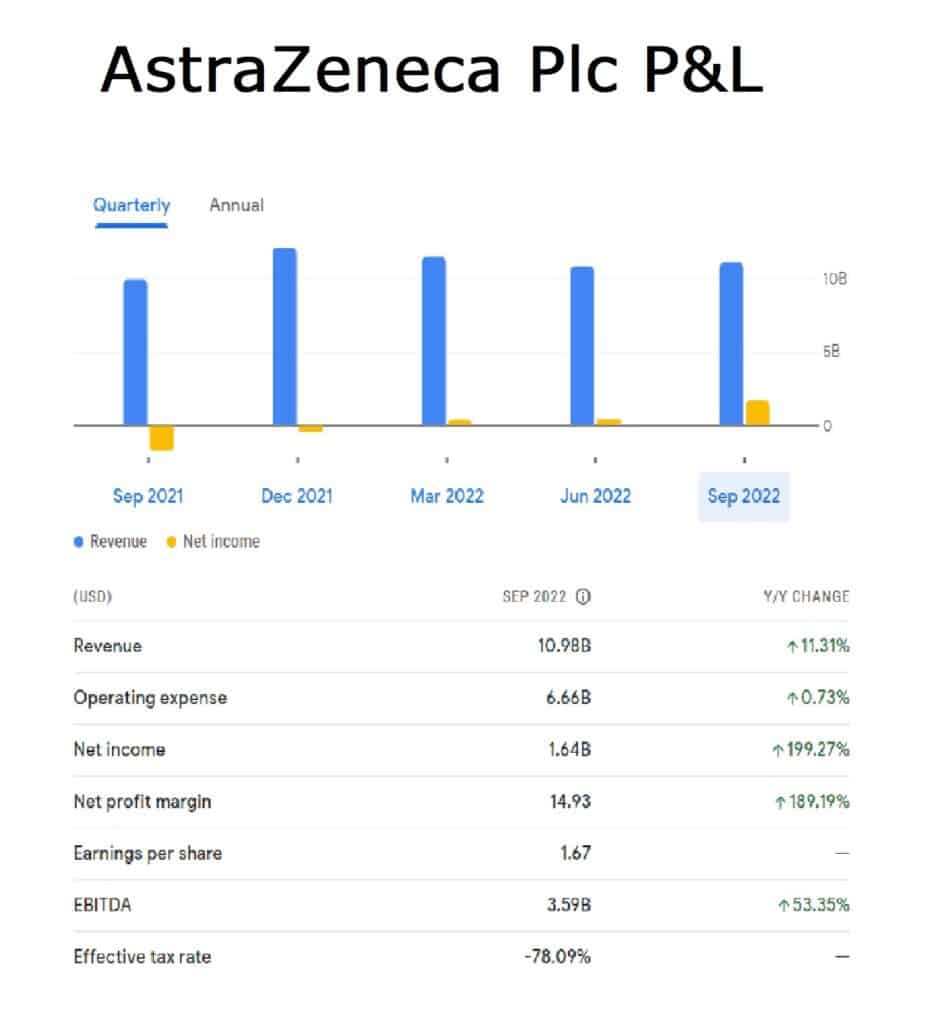
The “Profit and Loss Account” or in the U.S. “The Income Statement” groups inflows and outflows to show the total value of sales the company has made, and how many expenses it has incurred. The difference between the two is the company’s profit or loss for the year and relates to the profit and loss account on the balance sheet.
It does not include cash the company has borrowed or that the shareholders have invested, that is classified as capital, not revenue. It has not been earned from general operations. Capital expenditure on fixed assets is not included either on the profit and loss account as these assets are not bought and sold in the normal run of business in the way that current assets are.
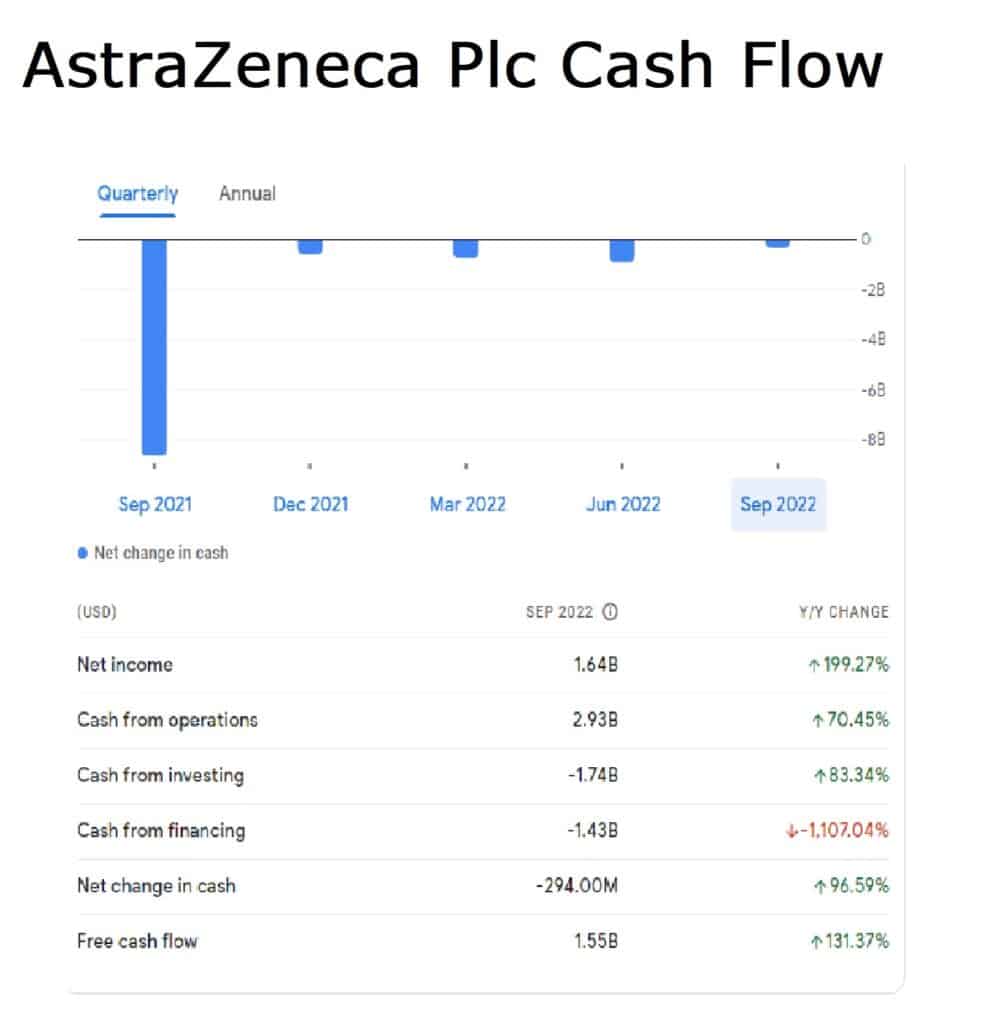
The “Cash Flow Statement” shows how much cash the company has spent or received over the accounting period and relates to the cash asset on the balance sheet.
Unlike the profit and loss account this includes cash spent or received through capital investment decisions, expenditure and any cash in savings account or financing. Cash in accounts means cash savings and any money the company can access quickly to pay people, and that the investment account running out of cash is the most common reason that companies become insolvent and go out of business.
In the tables below there is a quick summary of the latest financial statements from our example company, AstraZeneca Plc for Q3 2022 and a comparison of stock prices shows that over the past 5-Years it has proved a great investment as it outperformed GSK Plc, Novartis AG and Pfizer Inc.