What are the main Trading Theories?
In trading, there have been many theories over the years that people stick to and base their strategies off of. The main trading theories include; Dow Theory, Elliot Wave Theory, Gann Theory, Auction Market Theory, Efficient Market Hypothesis and Market Anomalies. We will look at these in more depth in this article.
Trading Theories Explained
Trading theories are ways for you, analysts and traders to try to make sense of what is going on in markets. Why they move as they do, where are the potential price movements in the future, up or down and to what extent markets might move in either direction.
Trading theories also try to explain the value of assets and why they should be priced at any particular level.
Why are Trading Theories Important?
Trading theories are important as they allow you to create a defined structure within which do trade. From the various trading theories, it is possible to create a trading strategy and a way to decide on market direction, trade entry and exit levels.
What are the Main Types Of Trading Theory?
The main types of trading theories are:
- Dow Theory
- Elliot Wave Theory
- Gann Theory
- Auction Market Theory
- Efficient Market Hypothesis
- Market Anomalies
We are now going to look at these in turn.
Dow Theory
Dow theory has been pulled together from a series of articles written by Charles Dow in the late 19th century in the Wall Street Journal and the theory is viewed as the birth of technical analysis in the western world, with Dow seen as the forefather.
Dow theory is now commonly seen as having 6 core principles or tenets:
- Markets discount everything – Anything that could or has moved the market price is already discounted into the price, including the behaviours and positioning of investors and traders.
- There are three market trends
- The primary trend (or major trend), which is long term, from less than a year to several years
- The secondary trend (or medium trend), from maybe two weeks to multiple months, which would be counter to the primary trend.
- Minor trends, that last for days or a few weeks, which are viewed as market” noise”
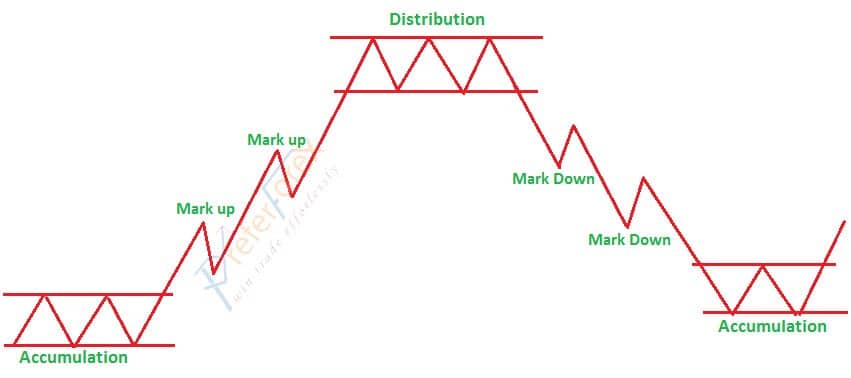
- Primary trends have three phases – the accumulation phase, when “smart investors buy in a bull market, the participation or mark-up phase, with broad based buying of stocks and the distribution phase, when the smart money starts to liquidate their long exposure
- The averages must confirm each other – Dow stated that the Industrial and Transportation averages must be moving in the same direction to be sustainable. Today we might look at different averages in a country (the S&P 50 and the Nasdaq, or maybe across international indices for confirmation.
- Volume must confirm the trend – When markets move, they must see significant volume, or the price moves are unlikely to be sustainable.
- Trends persists until reversed – It is only when say the secondary trend significantly reverses the primary trend, that a new primary trend in the opposite direction can be said to have begun.
Elliot Wave Theory
Ralph Nelson Elliott published his Elliott Wave theory in a book, “The Wave Principle”, having developed the theory in the 1920-30s, building on the aforementioned Dow Theory. After analysing decades of data, Elliot realised that stock markets moved in cycles and waves that repeated, driven by investor and trader emotions, that were influenced by external forces alongside the mass psychology of the moment.
Elliott noticed that the waves and cycles had the same patterns that repeated, which could be used to predict future prices. He identified impulsive waves in the direction of the trend and then corrective waves which were counter to the trend. For every impulsive move there would be a corrective one and he broke the waves into what he described as fractals.
Wave structures can be split into parts and Elliott waves are split into these fractals.
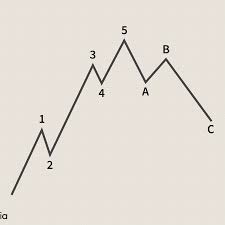
Elliott highlighted that a trending market moves in a 5-3 wave pattern, the first five waves are called impulsive ways and the last three waves are called corrective waves. Waves 1, 3, 5 are describes as motive, that is in the direction of the overall trend, with waves two and four corrective.
In turn, the five-wave trend is then corrected by a three-wave countertrend, ABC, as in the image.
Many traders and technical analysts still use Elliott Wave theory as the basis for their trading and market strategies.
Gann Theory
W.D. Gann was an analyst and traders from the early 20th century who developed a technical analysis theory based on what he called Gann angles as part of Gann Theory. His theory is based on geometry, but also has elements drawn from astronomy and astrology, which means his theory is often questioned.
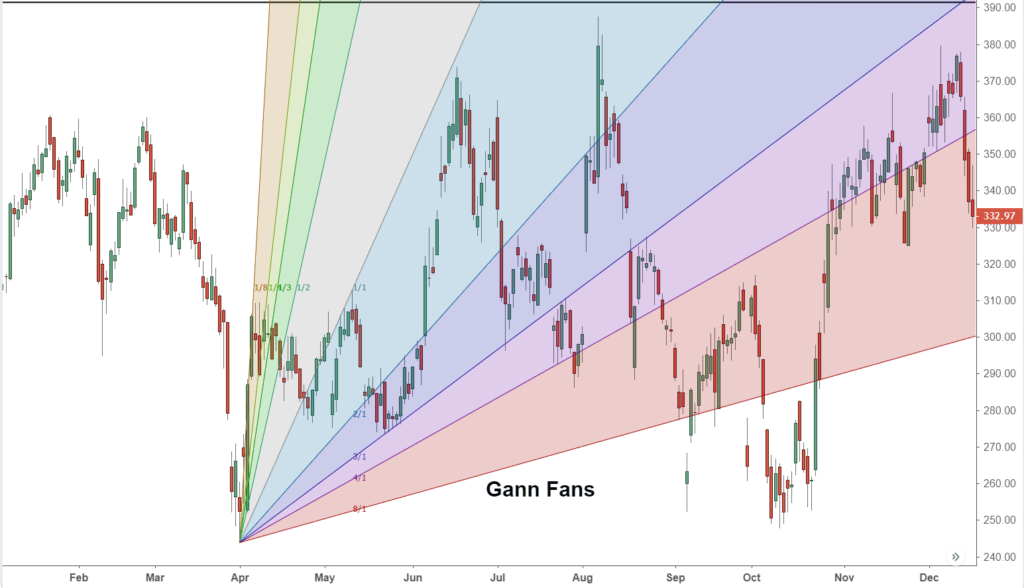
Gann theory does include timings that are focused on planetary configurations and eclipses, but he is still probably best known for the work on Gann angles. Gann believed that the ideal price and time balance was when they moved at the same pace, so price moves identical to time. Therefore, when the Gann angle is at 45 degrees. One unit of price equals one unit of time, which is 1×1 or 45 degrees. The other Gann angles are 2×1, 3×1, 4x, 8×1 and 16×1. If the market is moving higher above the 1×1 or 45 degree line it is a bull market, below this is a bear market.
Auction Market Theory
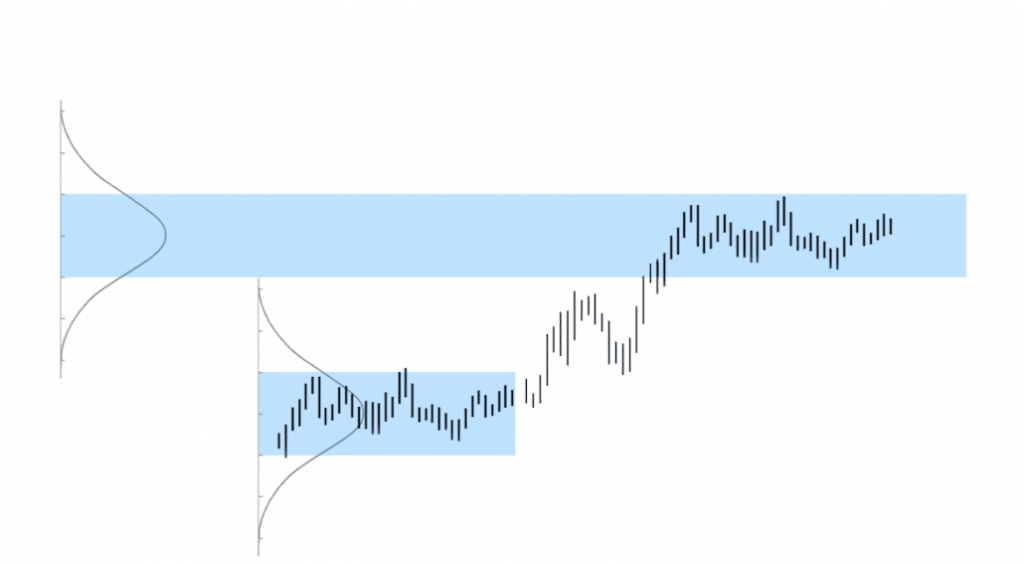
Financial markets broadly work using Auction Market Theory. “Price discovery”, which is where the market is currently trading, is achieved by the constant interaction between buyers and sellers in the marketplace. The “fair value” or “fair price” of the market is achieved by this constant interaction, as supply and demand constantly look for balance. This is the basis of Auction Market Theory popularized by J. Peter Steidlmayer in the 1980s and his Technical analysis approach called Market Profile. Auction market theorists see “fair value” by observing where price; posted the most volume, traded the most often in turn of time and showed the least “conflict” between buyers and sellers. By identifying “fair value”, it is possible to form a trading plan, where you can look for the market to move towards these levels or areas of “fair value”.
Efficient Market Hypothesis
Efficient Market Hypothesis or EMH is also know as Efficient Market theory. EMH states that the market price reflects all the possible information available, with the conclusion drawn from this that it is impossible to consistently achieve what is known as “alpha”, which basically means that you cannot beat the market. Stocks for example are always trading at their “fair value”, so they are never under or overvalued, so you cannot buy a “cheap” stock or go short on an overvalued “expensive” one. In this scenario, the best strategy is to be passive, to just buy and hold.
However, EMH is quite controversial, with many critics pointing to the fact that investors can and do consistently beat the market, with Warren Buffet often highlighted as an example of this. Also, stock market bubbles and crashes are instances when stock prices stray from their fair values. Also, market anomalies as we discuss below, reflect the fact that markets are not efficient. Finally, behavioural economics and the psychological nature of trading and investing points to the fact that market participants, the traders and investors, do not always behave rationally, so markets are not efficient.
Market Anomalies
Market anomalies are a way of explaining the difference between an actual price of an asset class (for example a stock) in relation to what would be the expected price according to Efficient Market Hypothesis (EMH, as discussed above). Market anomalies, therefore, highlight that EMH does not always work. Here we will look at some of the more common market anomalies.
One of the more common areas of market anomalies are the calendar effects.
These would include:
- The Monday effect come up where stock prices tend to close lower on a Monday in comparison to the prior Friday
- The turn of month effect, where a market would rise at the end of a trading month and early into the next month.
- There is also the January effect, where markets, particularly stock markets experience an increase in both volume and also higher stock prices at the end of the year and for the beginning of a new year.
- Then there is the holiday effect, where markets (again typically share markets) rise the day before a market holiday.
Other market anomalies include the stock split effect, where markets rise in anticipation of a stock split announcement or when a stock split is announced. The announcement drift effect whereby markets continue to move after a significant announcement, not as EMH would suggest moving quickly, even immediately to and new efficient price level.
There are also other market anomalies including the value effect, the momentum effect and superstitious effects.
Trading Theories Summary
In this article on technical analysis we have looked at the main trading theories and explained what they are and why trading theories are important. We have also gone on to explore and delve into the main types of trading theories. To learn more about trading check out our article on trading charts.
