The minutes of the June FOMC meeting did not tell us a huge amount that we already did not know. However, they do confirm the hawkish lean on the committee which leaves the Fed on a continued path of tightening despite the recent pause in rate hikes. The move higher seen in US Treasury yields over recent weeks has come as Wall Street has continued higher. However, can the two moves continue to run in lockstep? Initial signs are that Wall Street is beginning to sag.
- Hawkish Fed minutes confirm market positioning
- The prospect of more rate hikes is driving higher US Treasury yields
- A multi-month Wall Street rally is starting to be questioned
The minutes confirm a hawkish Fed
Last night’s minutes of the June FOMC meeting confirmed that the Fed still has more room to run in its tightening of monetary policy. Even though “some participants” wanted to continue to hike rates, the decision to maintain the federal funds rate in a range of 5.00% to 5.25% was taken by “almost all participants”.
It was felt that pausing the rate hikes would give them time to assess the uncertainty of the economic outlook. However “almost all” participants also believed that more tightening was likely this year. This is reflected in the dot plots of projections in interest rates which have 16 of the 18 dots above the current level.
I previously discussed how the economic data would be key and the potential for weaker US data to impact positioning for further Fed tightening. However, the firm positioning of the FOMC to continue with rate hikes this year that come from these minutes will act as a buffer to any downside reaction to the data. The immediate focus will be on the ISM Services and Nonfarm Payrolls data, but also on US CPI too. There will likely need to be a decisive trend of negative surprises in the jobs, wages and inflation data to significantly shift market positioning for a hike in the next couple of meetings.
The move towards higher Treasury yields continues
We did not see much reaction on Treasury (UST) yields to the June FOMC meeting. However, there has been a notable move higher in the past week. This has come as markets have positioned more decisively for another rate hike and pushed rate cuts deeper into 2024. This move higher in UST yields has accelerated on the minutes. Concerns over stubborn inflation needing higher rates for longer is driving the 10-year yield towards 4.00%.
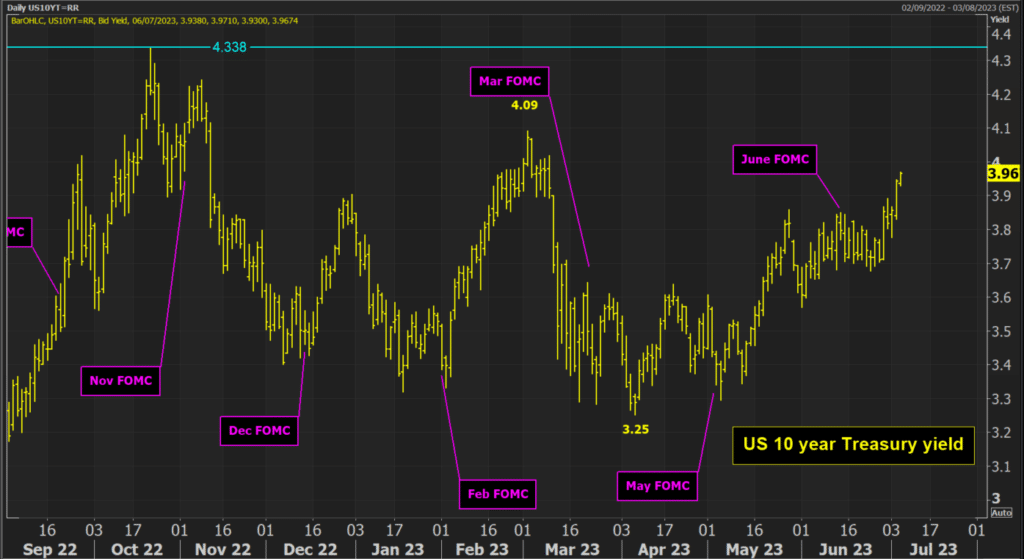
The March high of 4.09% is now within touching distance. According to the CME Group FedWatch tool, there is now a 38% chance (and growing) of another rate hike towards a range of 5.50% to 5.75%. The October jump in the 10-year yield to 4.34% came as markets were thinking perhaps 6% was possible. There is room to run in yields moving higher, especially if the CPI inflation data remains stubbornly high.
Higher real yields have come as Wall Street has moved higher
This matters because for the vast majority of the past year, real US bond yields (as measured by the US 10-year Treasury Inflation Protected Securities) have run a very strong negative correlation with the futures of NASDAQ 100 and S&P 500. When yields move lower, this has supported index futures, and vice versa.
However, yields have risen decisively over the past three months, but this has coincided with a rise in index futures too. This is counterintuitive. Furthermore, it has pulled the correlation between the two from being consistently negative to being decisively positive.
Here is a chart of the e-mini S&P 500 futures versus US real yields. It shows that there has been a strong negative correlation between the two until the past couple of months when the relationship has turned positive.
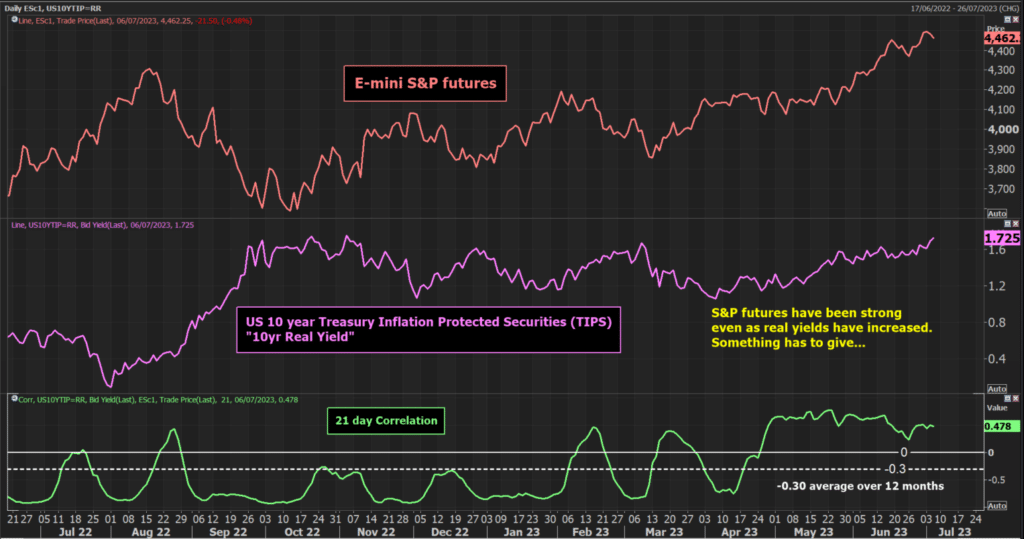
However, there are signs of this nascent positive relationship starting to crack. There are hints of the two starting to diverge. Furthermore, the reaction to last night’s FOMC minutes was for index futures to fall. Traders are increasingly coming to the realisation that the Fed is highly likely to tighten further and remain tight for longer. This is certainly not bullish for index futures. Could this be the beginning of the normalisation of the correlation?
There is a similar look to the chart of e-mini NASDAQ 100 futures versus real yields too.
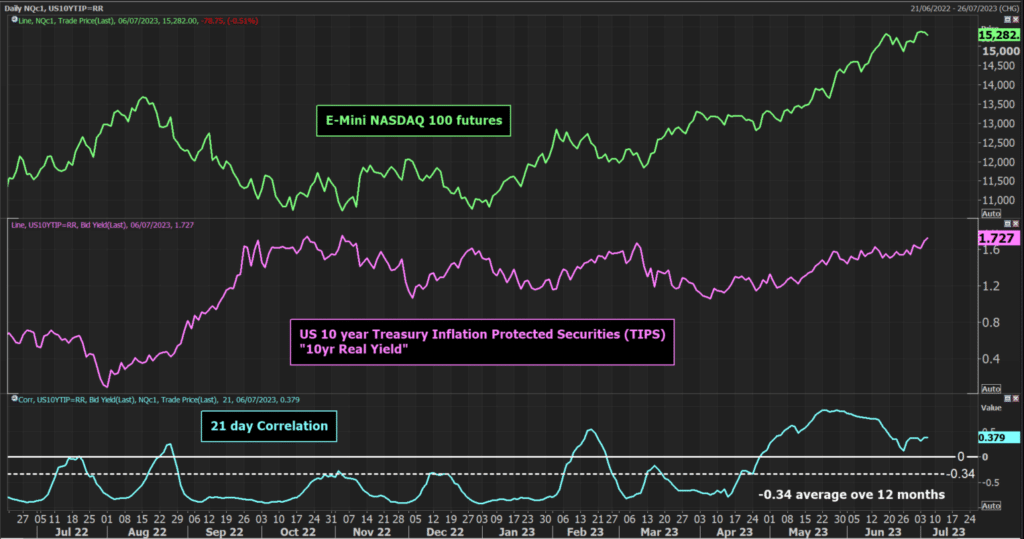
Whilst this positive correlation has developed as the two have trended together in recent weeks, again there are signs of a divergence in the correlation, but also in the reaction on NASDAQ futures to the minutes.
I believe that to have yields rising and index futures rising over the medium term is unsustainable. If yields continue to rise, then even the NASDAQ with its weighting in Big Tech stocks will struggle to sustain its rally.
Now, there is nothing confirmed yet, and there is a raft of important economic data to hit the wires in the coming sessions. However, if the rise in UST yields holds, this could be a corrective signal for US index futures.
