Richard Perry

Richard Perry

Editor
Richard is an independent market analyst with over 20 years of experience working for brokers in London. Most recently he has worked with Hantec Markets and Infinox, focusing on trading education, analysis and research of global financial markets. Richard uses a blended analysis style focusing on fundamentals and technicals in the production of his written reports, analysis videos and trading webinars. Since graduating from the University of Reading with a 2:1 in Politics & Economics, Richard has gained professional qualifications in the Society of Technical Analysts diploma (where he received a distinction) and the Private Client Investment Advice & Management qualification (achieved with merit). He has been interviewed frequently on news channels such as CNBC, Bloomberg and Sky News. Richard has extensive experience of writing for industry journals such as Shares Magazine and Investors Chronicle. He also has experience in hosting seminars at trade shows and educating traders around the world.
Beginner

Support and Resistance Explained

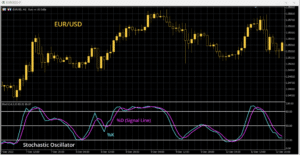
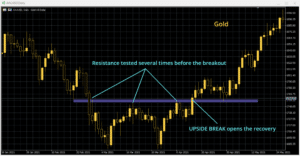
The concept of support and resistance The interaction between buyers (demand) and sellers (supply) is a crucial aspect of how prices move in financial markets. Which side is dominant determines whether a price will move higher or lower. However, when the balance of dominance shifts between the buyers and sellers, this is when markets change … Continued

Beginner

Stochastics Explained

What are the Stochastics? The Stochastic Oscillator, or Stochastics for short, is a technical analysis momentum indicator developed by George Lane in the 1950s. It is a two-line indicator comprising the Stochastic Oscillator (%K) and a Signal Line (%D). The indicator looks at the latest closing price measured against the price range over a specified … Continued

Beginner

Relative Strength Index (RSI) Explained

What is the RSI? The Relative Strength Index (RSI) is a technical analysis indicator that is a measure of momentum in the price movement. The RSI measures the magnitude of the price change. It is an oscillator indicator (values move between 0 and 100) developed by a technical analyst called John Welles Wilder Jr. The … Continued

Beginner

Moving Averages Explained

What is a moving average? A moving average is a smoothed line on a price chart that illustrates how price has moved over time. It takes an average of prices over a specific period. A 20-day moving average will take the average price over the last 20 days. A 20-hour moving average will be an … Continued

Beginner

MACD Explained

What is the MACD? The MACD (Moving Average Convergence/Divergence) is an indicator that combines two forms of analysis, trends (using moving averages) and price momentum. The indicator is traditionally constructed by using two exponential moving averages calculated over 12 periods and 26 periods. The indicator uses two lines (the MACD Line and the lagging Signal … Continued

Beginner

Line Charts, Bar Charts and Candlesticks Explained

Chart Types Standard trading platforms will allow traders to view price moves as trading charts in three main ways. Line charts are the simplest representation of price action. Bar charts include additional detail about important price levels of the period. Candlesticks go one step further than bars to also visually reflect the direction of the … Continued

Beginner

Breakouts & Breakdowns Explained

What are Breakouts (and Breakdowns)? Support and resistance and the market reaction to breaking them are key concepts in technical analysis and trading. When the barriers that have been holding back the price are broken, it signals a change in the outlook for the market. A breakout signals an important next move for the price. … Continued

Beginner

Triple Tops & Triple Bottoms Explained

What are Triple Tops and Triple Bottoms Triple Tops and Triple Bottoms are identifiable as price patterns. Once the pattern has completed following a breach of the neckline, they come with measurable implied targets for the subsequent price move. Triple top pattern – After a sustained move higher in price, there is a peak and … Continued

Beginner

Rounding Tops & Rounding Bottoms Explained

What are Rounding Tops and Rounding Bottoms Rounding Tops and Rounding Bottoms are reversal patterns that are slow and considered but ultimately result in decisive trend-changing moves. Instead of the identifiable peaks and troughs that come with spotting other reversal patterns, the rounding reversals are more of a gradual base or top pattern. Rounding tops … Continued

Beginner

Reversals Explained

What are reversal patterns? Reversals are identifiable patterns that develop in the movement of the price. Reversal patterns signal a significant change in market direction has occurred. There can also be implied price targets that can be derived from the pattern. The important feature of a reversal is that the price breaks an important and … Continued

Beginner

Rectangles Explained

What is a rectangle pattern? The rectangle is a consolidation pattern that signals a pause within a trend. The rectangle pattern develops between lines of horizontal support and resistance. However, importantly, they are seen as continuation patterns, with the pause coming before a breakout in the direction of the prevailing trend. The opposite of a … Continued

Beginner

Head & Shoulders Tops and Head & Shoulders Bottoms

What is the “Head & Shoulders” pattern? The “head and shoulders” is one of the most recognisable and famous price patterns in technical analysis. It is a pattern that signals a reversal in the price, with the formation of a new trend. The patterns come with key characteristics: Head & Shoulders Top The head and … Continued

Beginner

Double Tops & Double Bottoms Explained

Double Tops Double Tops and Double Bottoms are identifiable as price patterns and are a common form of reversal. Once the pattern has completed following a breach of the neckline, they come with measurable implied targets for the subsequent price move. Pattern completion and confirmation As ever with technical analysis, it is important to wait … Continued

Beginner

Continuations Explained

What are continuation patterns? Continuations are patterns that are consolidations in the price that once completed enable the continuation of the established price move. The important feature of a continuation pattern is that the price consolidates within an existing trend, with the breakout that completes the pattern moving in the direction of the prevailing trend. … Continued

Beginner

The Federal Reserve Explained

The Federal Reserve (also known as the Fed) is, quite simply, the world’s most important financial instution. It is the central bank of the United States, which is the world’s largest and most important economy in the world. It governs the money supply of the US dollar, which is the world’s primary reserve currency. The … Continued

Beginner

Nonfarm Payrolls Explained

The Nonfarm Payrolls data is traditionally seen by traders as the most important economic data of the month. It records how many jobs were added in the United States in the prior month. The more jobs that are being added, the stronger the outlook for the US economy. Nonfarm Payrolls (NFP) data is announced as … Continued

Beginner

What is trading range and how does it work?

As a trader, one of the key concepts you must be aware of is trading ranges. You must be able to understand them and use as part of your technical analysis. This article will give an in depth review on trading ranges with examples making sure you understand them. What is trading range? Let us … Continued

Beginner

Monetary Policy and Interest Rates Explained

Monetary policy is the way that a central bank manages an economy. It is effectively the control of the supply of money in the economy. A central bank aims to promote stable economic growth. It looks to achieve this via monetary policy. Over time, an economy can either overheat or contract too much. The central … Continued

Beginner

The European Central Bank (ECB)

The European Central Bank (also known as the ECB) is the central bank for the euro area. It has the power to set monetary policy for the 19 countries of the Eurozone. Its mandate is to create price stability for the euro area. To achieve this, the ECB targets a 2% level of inflation. This … Continued

Beginner

Trade Nonfarm Payrolls (NFP)

What are Nonfarm Payrolls? Nonfarm Payrolls (NFP) data show the headline jobs growth for the US. It is announced monthly as part of the broader US Employment Situation report which is an update on the state of the US labour market. Here we show a more detailed assessment of what Nonfarm Payrolls are. Financial markets … Continued

Beginner

Stagflation Explained

What is Stagflation? Stagflation is a term used to describe a specific state of an economy. It is a combination of two words: stagnation and inflation. For an economy to be experiencing “stagflation”, there are certain criteria that need to be occurring: When all of the conditions occur simultaneously, then the economy can be said … Continued

Beginner

Rally Explained

What is a rally? A rally is a general term used in financial markets for a sustained price rise. Classically, a rally would have been seen as a rebound in price following a previous move lower. However, the term is used far more broadly now to cover a broad price rise. A rally can last … Continued

Beginner

Producer Price Index (PPI) Explained

What is the Producer Price Index? The Producer Price Index (abbreviated to PPI) is an inflation measure that looks at the change over time in the prices experienced by domestic producers. The PPI is primarily the change in prices paid to producers for their output of goods and services. The data is compiled from thousands … Continued

Beginner

Purchasing Managers’ Index (PMI) Explained

What is the PMI? The PMI or Purchasing Managers’ Index compiles a survey of economic trends for a country in sectors such as manufacturing and services. The data is released monthly and is one of the first and most current data sets to be released. The composite PMI compiles the surveys to give an outlook … Continued

Beginner

Inflation Explained

What is inflation? At a most basic level, inflation is the rise in prices over time. It also represents the change in purchasing power. As inflation rises, the purchasing power to buy a basket of goods will decline. One unit of currency will be able to buy fewer goods or services than it did previously. … Continued

Beginner

Indices Explained

What are stock indices? A stock index (the plural of “index” is “indices”) is the measure of the performance of a basket of equities over time. Indices are an aggregation of the performance of the companies that are the constituents of that index. They are used as a gauge of performance for equity markets. Index … Continued

Beginner

Hawkish Explained

The term “hawkish” is applied to any person or organisation that approaches a situation with an aggressive response. For financial markets, the term tends to mostly be associated with central banks and their outlook for monetary policy. A central bank (or central banker) is hawkish if its response to an overheating economy is to use … Continued

Beginner

Forex Explained

What is forex? Foreign exchange (forex or fx for short) is a term used for the exchange of one currency for another. When a person wants to change money from one currency into another they are taking part in the forex market. If a company needs to buy goods from another country, it will need … Continued

Beginner

Exchange Traded Fund (ETF) Explained

What is an Exchange Traded Fund? An Exchange Traded Fund (ETF) is a basket of investments that trade as a security. Most ETFs are designed to track the performance of an index or a basket of assets. As such they are considered to be “passive” investments and subsequently, this helps to reduce costs. Some ETFs … Continued

Beginner

Equities Explained

What are equities? Equities (also known as stocks and shares) represent the fractional ownership of a company. When corporations are publically owned, they will be listed on a stock exchange where their shares can be bought and sold by private investors. Private investors and investment companies will take ownership of equities. This gives them certain … Continued

Beginner

Earnings Season Explained

What is Earnings Season? “Earnings Season” is a period when publically traded companies announce their results (how the company is performing). There are four earnings seasons per year which is why it is also often referred to as “Quarterly Earnings Season”. In the US, companies tend to have similar period end dates and also tend … Continued

Beginner

Dovish Explained

The term “dovish” is applied to any person or organisation that approaches a situation with a passive response. In financial markets, the term dovish tends to be associated with central banks and their outlook for monetary policy. A dovish central bank (or central banker) uses easy monetary policy in response to a low or negative … Continued

Beginner

Cryptocurrencies Explained

What are cryptocurrencies? Cryptocurrencies are digital currencies. They are a decentralised form of payment that is seen as an alternative to “fiat” money (paper money that can be printed into infinity by central banks). Cryptocurrencies are secured by cryptography (such as using blockchain technology) that ensures the security and transparency of transactions. Cryptocurrencies can be … Continued

Beginner

Correlation Explained

Correlations arise as the movement in one asset price can be linked to another. A correlation between two assets can be positive, negative, or not correlated. What is a correlation? A correlation is a statistical relationship between two variables. In finance markets, a correlation refers to the link between two assets or trading instruments. How … Continued

Beginner

Correction Explained

A correction in the price of an asset is an unwinding move after a prevailing run higher. The strict definition of a correction is a price move that has unwound between 10% and 20% following a significant high. When the price falls more than -20% the move changes from being a “correction” to being a … Continued

Beginner

Consumer Sentiment Explained

What is consumer sentiment? Consumer sentiment is a measure of the health of an economy from the perspective of the consumer. It is a survey of how optimistic consumers feel about the health of their finances and the economy as a whole. As an economy matures, consumer spending becomes an increasingly important component of the … Continued

Beginner

Commodities Explained

Commodities are the naturally occurring raw materials that are used for manufacturing, production and the consumption of food. They are traded physically on exchanges or through derivative products and funds. What are commodities? Commodities are the raw materials that are used as the building blocks for other processes. Processes can include the manufacture of goods … Continued

Beginner

CFDs Explained

What are CFDs? A Contract For Difference (CFD) is a derivative product which allows traders to speculate on the movement in the price of an asset. Put simply, a CFD is a contract between two parties, a buyer and a seller. Both parties agree to exchange the difference in the value of a financial asset … Continued

Beginner

Bulls, Bullish and Bull Markets Explained

In the purest sense, a positive person can be referred to as a “bull” and, as such, they can be “bullish”. The term is most commonly associated with trading in financial markets. A bull is a market participant that has a positive outlook and believes prices will be moving higher. The term “bull” is also … Continued

Beginner

Bears, Bearish and Bear Markets Explained

Any negative person can be referred to as being a “bear” and, as such, they can be described as “bearish”. The term is most commonly associated with trading in financial markets.   In the world of finance, a bear is a market participant that is negative about the direction of markets. They subsequently believe that … Continued

Beginner

Basis Points Explained

“Basis Points” (often shortened to “bps”) are a term used by financial market participants and institutions to express the change in value or interest rate of financial instruments. They are used to standardise changes in the value of financial instruments that are priced in percentages. Instruments such as interest rates or bond yields move in … Continued

Beginner

Spinning Top Candlestick Explained

A Spinning Top is a candlestick that indicates indecision in the market. It can be a warning signal that a potential change in outlook is developing. It is a small-bodied candlestick with long upper and lower shadows. The position of the candlestick “body” around the mid-point of the daily range suggests neither the buyers nor … Continued

Beginner

Shooting Stars and Hanging Man Explained

The Shooting Star is a popular bearish candlestick pattern that can be a powerful trend reversal signal. It is considered to be the polar opposite candlestick of a bullish Hammer. It generates the highest conviction when it is posted at the end of a decisive uptrend phase. It signifies exhaustion in the buying pressure before … Continued

Beginner

Doji Candlesticks Explained

A Doji candle can be an important signal in candlestick analysis. Where the OPEN price is equal to the CLOSE price, a doji candlestick has formed. Classically, a doji candle denotes uncertainty in the prevailing trend and is arguably a neutral signal. However, it would be wise not to dismiss them as trading signals. They … Continued

Beginner

Bullish Engulfing Explained

The Bullish Engulfing is one of the most powerful reversal signals. It indicates the exhaustion of a downtrend phase and the beginning of a new positive trend. The candlestick reversal starts with the market OPEN below the previous CLOSE (with a gap lower). The price then starts to move higher early in the session (the … Continued

Beginner

Bearish Engulfing Explained

A Bearish Engulfing candle is a bearish two-period reversal pattern. It can often be a very powerful reversal signal. The Bearish Engulfing can indicate exhaustion in buying pressure after a phase of positive price action. It is a candle that signals the beginning of a new trend of lower prices. The candle is most effective … Continued

Beginner

Piercing Line Candlestick Explained

A Piercing Line is a two candlestick pattern that is a bullish set-up that implies that the price has finished falling and is ready to start moving higher. It is best seen after a downtrend in the price. Candle 1 is a decisive bearish candle. It has a strong move lower from OPEN to CLOSE … Continued

Beginner

Morning Star Patterns Explained

A Morning Star is a three candlestick pattern that signals a key turning point in the market. It occurs when a decisive downtrend of selling pressure meets a point of exhaustion. This proves to be the key low of the trend. With the selling exhausted, the market then swings back higher for the start of … Continued

Beginner

Hammers & Inverted Hammers Explained

Hammers are some of the most popular and easily recognisable patterns in candlestick analysis. They can be a powerful and bullish reversal signal. The hammer is probably best defined as being a signal that comes at the end of a phase of selling pressure. After the open, the price falls to hit a new low, … Continued

Beginner

Evening Star Candlestick pattern Explained

An Evening Star is a three candlestick pattern that indicates a significant turning point in the market. It suggests that a prevailing uptrend has become exhausted and that a new trend of lower prices is coming. A bullish trend is being replaced by a new bear leg for the market. The perfect set-up has a … Continued

Beginner

Dark Cloud Cover Explained

A Dark Cloud Cover is a bearish two-candlestick pattern that implies the end of a bull phase and the beginning of a new phase of selling. It is best seen at the end of an uptrend in the price. Candle 1 is a decisive bullish candle. The price moves strong higher between the OPEN and … Continued

Intermediate

Nvidia blows the top off estimates, driving a decisive Wall Street rally

One of the big stories of 2023 has been the impressive rally of the NASDAQ and the huge outperformance of Big Tech. The main driver of this has been US chipmaker, Nvidia. The semiconductor company that provides the processors crucial for Artificial Intelligence applications such as ChatGPT, has been at the forefront of the tech … Continued

Intermediate

Oil futures could top out amid a shift in supply/demand dynamics

There has been a decisive recovery in oil futures since late June. A recovery that threatened to break decisively clear of key resistance and change the medium to longer-term outlook. However, the mood has shifted in the past couple of weeks, with futures going into retreat. This has come as there has been a shift … Continued

Intermediate

Mounting corrective forces are dragging US index futures lower

There has been a shift in sentiment in recent weeks. After having rallied consistently for over four months, US index futures have turned lower. Previously, unwinding moves were seen as a chance to buy. However, we are increasingly now seeing rallies used as an opportunity to sell. The corrective forces are mounting, both fundamentally and … Continued

Intermediate

A chink of light for NZD bulls with the RBNZ to remain “restrictive”

Perception can be crucial to the performance of an asset. Traders have been focused on the Reserve Bank of New Zealand (RBNZ) having finished its hiking cycle. With other major central banks either still tightening, or potentially still tightening, the NZD has been mired in underperformance against major currencies. However, could this now be about … Continued

Intermediate

Further evidence of waning US inflation weighs on USD

We know from Fed Chair Powell at the July FOMC meeting that the Federal Reserve is data-dependent. It means that the data for the US labour market and inflation this month and next month (that comes out before the September FOMC meeting) will be crucial in helping to formulate the monetary policy decisions in the … Continued

Intermediate

US earnings season has failed to ignite index futures

Q2 corporate earnings season in the States has been little help for US index futures. Despite it being a strong earnings season for positive surprises, the associated boost that markets have been lacking. It means that as earnings season winds down, the positive outlook on the technical analysis will have plenty of heavy lifting to … Continued

Intermediate

Gold has become the summer range play

The outlook for gold remains closely tied to the direction of the dollar. The recovery in the US dollar in the past couple of weeks has been negative for precious metals. Although gold may be holding up better than others in the precious metals space, it is still struggling amid a resurgence in the USD. … Continued

Intermediate

A dovish hike from the Bank of England weighs on GBP

The Bank of England has hiked once more, for the 14th meeting in a row. However, just as other major central banks (such as the Fed and the ECB) have done recently, there was more of a dovish tilt to the decision this time. A 25 basis points hike to 5.25% is leaving GBP traders … Continued

Intermediate

Is the EUR start to build support again?

Anyone long of EUR has had a bit of a rough ride since the European Central Bank meeting at the end of July. Christine Lagarde shifted from a decisively hawkish position in the previous meeting to one of considerable uncertainty. The EUR was hit hard on its major crosses. However, with an unexpected upside surprise … Continued

Intermediate

AUD pairs are at a key crossroads as inflation falls further

The pressure on the Reserve Bank of Australia to continue to hike interest rates has further eased after the announcement that a range of inflation metrics had fallen more than forecast. The relative performance of the AUD on major forex has improved lately as currencies such as the EUR and GBP have suffered corrective pressure. … Continued