- In the past year “Risk On” assets have been in favour
- The past path of gold has not looked appealing, nut now that is changing
- The economic path to recovery is improving as are inflation prospects
- There is a case to open a speculative long on gold as the technicals look encouraging
In times of uncertainty one will often hear the expressions, “Flight to Quality” or “Flight to Safety”. However, as the global economy appears to be responding to the benefits of a wide scale vaccination process and stimulus driven growth prospects improve, one can see that “Risk On” assets such as equities have been favoured.
Figure 1 shows how volatility, as measured by the VIX Index has fallen in the past 12-Months as global equities have booked gains.
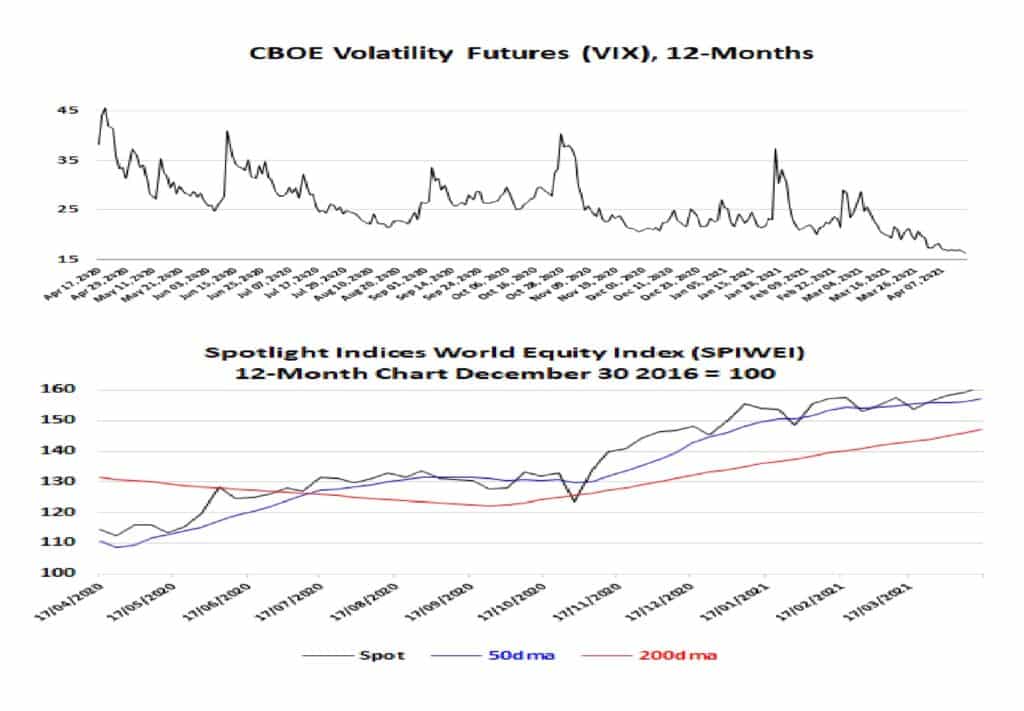
Despite the recent concern over Russian troop maneuverers near the Ukraine border, the markets do not seem too perturbed, there has been no rush to liquidate risk. With that in mind we see that over the past year the performance of a certain precious, yellow metal has been far from “golden”.
Over the past 12-Months gold has fallen by USD260.9/Troy Oz, that places it down by 12.79%. For 2021year to date the decline of gold as measured in USD terms is USD116.3/Troy Oz or -6.14%. In short, almost 50% of the price decline has been seen this calendar year during which time the Spotlight Indices World Equity Index has gained 10.99%
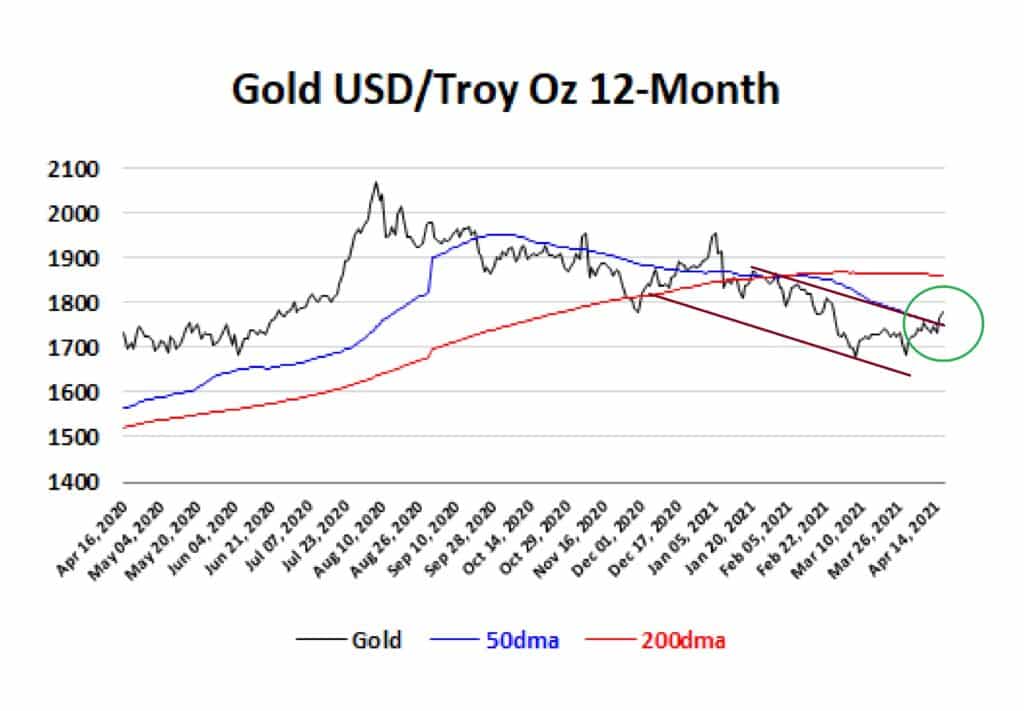
However, look again at Figure 2 and one can see on Thursday, April 15 the spot price of gold crossed above the 50-Day Moving Average (50DMA). That move marked a break above the corrective channel that has been in place since December 4, 2020.
This is a welcome break from the decline in Q1 and is reminder that at these relative cheap levels they may just be enough economic factors in play that make gold rather an alluring proposition.
Consider consumer confidence. In the U.S. a preliminary estimate showed the University of Michigan’s consumer sentiment rose to 86.5 in April 2021, from 84.9 in the previous month. Of course one must point out that the positive tone in current consumer confidence reflects much larger than usual stimulus payments during the past year and the good economic data.
In the Eurozone, the same metric was confirmed at -10.8 in March 2021, the highest level since February 2020, as households’ expectations improved both in respect of the general economic situation in their country, and their personal situation. That could yet reverse if the European vaccination programme continues to lag.
To stay upbeat, we see a similar pattern emerging in business confidence. In the U.S., the ISM Manufacturing PMI jumped to 64.7 in March of 2021 from 60.8 in February, well above market forecasts of 61.3. It is encouraging as it is the highest reading since December of 1983. In the Eurozone, business confidence increased to 0.30 points in March from -0.14 points in February of 2021.
Data from China is similarly buoyant as the economy advanced 18.3% YoY in Q1 2021, accelerating sharply from a 6.5% growth rate in Q4 2020. Consumer confidence in China increased to 127 points in February from 122.80 points in January and with regard business confidence the official NBS Manufacturing PMI for China rose to 51.9 in March from 50.6 in February, beating market consensus of 51.0; this was the highest reading since December 2020.
To overlay this positive economic backdrop I am still minded to look at the market signals in the U.S. when it comes to expected inflation.
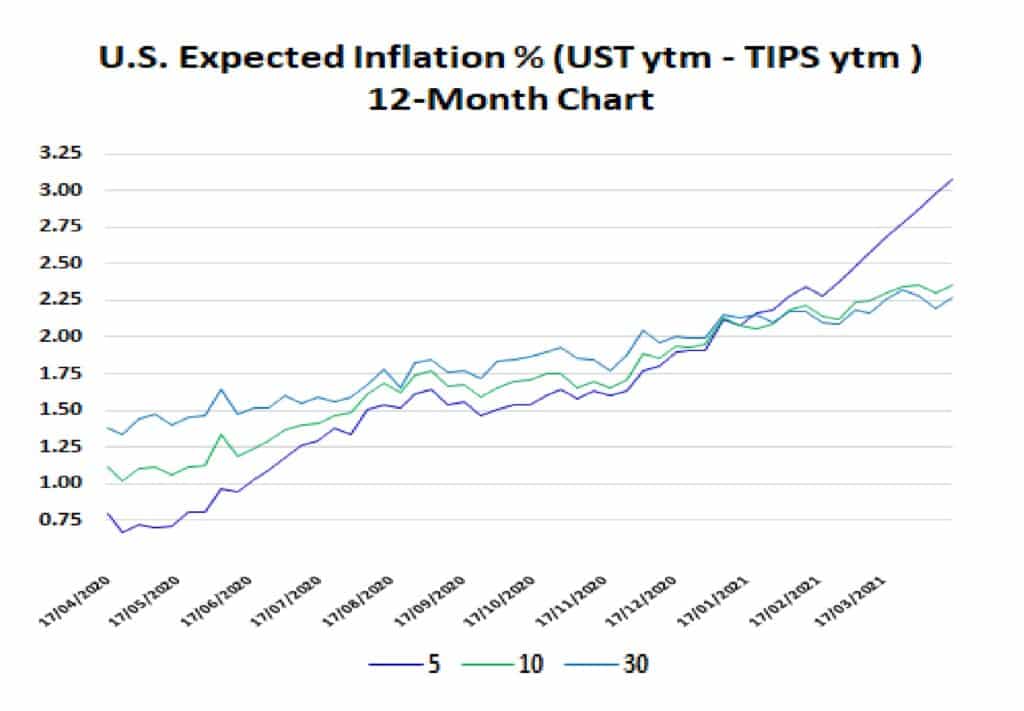
One can see from the trend illustrated in Figure 3 that over the past 12-Months the U.S. Treasury market has indicated that inflation expectations are rising with the five-year measure of T5 yield less TIPS 5 yield pushing above 3.0%. The reason for this is the market has taken to heart the sentiment that Fed Chair, Jerome Powell is not concerned about a slight blip over a theoretical 2.0% inflation target. He is looking for 2.0% as a medium-term average.
To back that view of a relaxed Fed I note that on Tuesday, April 13 Philadelphia Fed President Patrick Harker said:
“…At this point, we don’t expect inflation to be running out of control, … We have time to move because we’re not seeing inflation running out of control. If it does, we’ll act accordingly, …”
The U.S. consumer price index (CPI) rose 0.6% in March, the largest month-on-month gain since 2012. The 12-month rate rose to 2.6%. The Fed expects its preferred metric, the personal consumption expenditure index, to accelerate to a 2.4% annual rate this year before retreating next year. What worries many macroeconomists is the prospect that the massive fiscal stimulus passed by Congress earlier this year will cause the economy to overheat, sending CPI well beyond 2.0%.
This is something that needs to be watched and as the expected inflation at the five-year level shows in Figure 3 prices could gain by over 3.0% heading toward a 3.7% gain in May as weak readings from last spring,when the pandemic hit, drop out of the measure.
Historically, increased fears over inflation have usually, although not always, proved price positive for gold. The gold bears will argue that the economic recovery is heavily contingent upon government stimulus and the inflation fears may be getting little overblown. This is because there are few price pressures i.e. unemployment is still high, 6.0% in the U.S. and 8.3% in the Eurozone and capacity utilisation is just 74.4% in the U.S., 77.6% in the Eurozone and if curious it is 77.2% in China.
I like the fact that on balance the technical aspect of gold is at worst neutral and has several time measures that are listed as “Strong Buy”. Given the price has fallen by 6.14% in the year to date, I believe a small, speculative long may be called for.
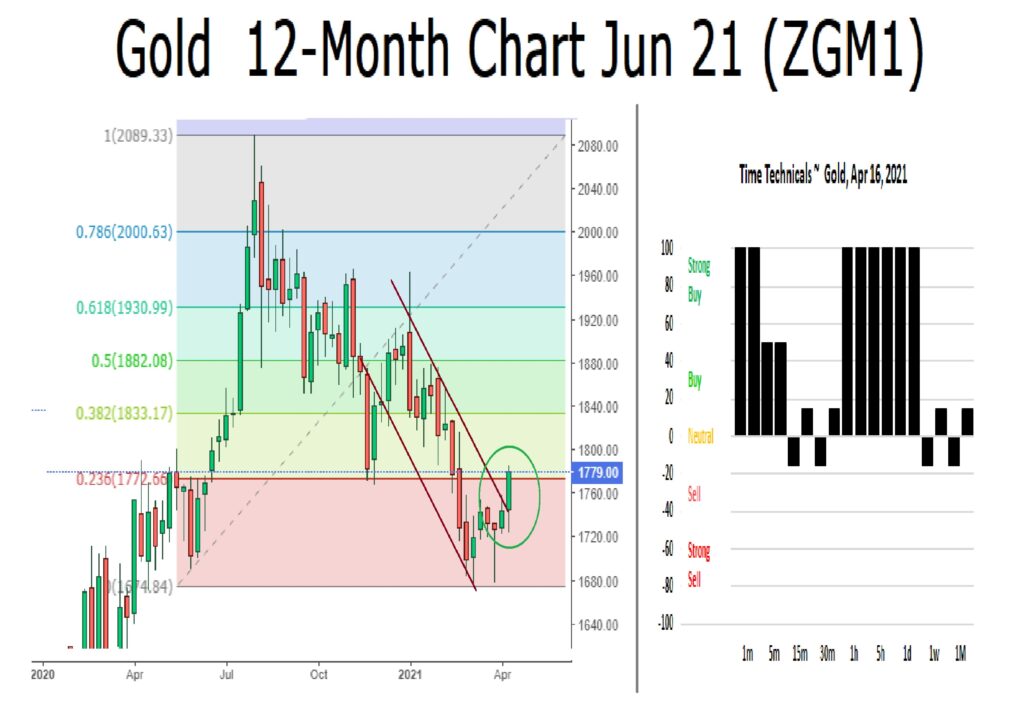
From here I would be a buyer with a first target set at USD1882.08/Troy Oz i.e. +5.8%. If this reached, I would reappraise at that time but have a stop loss set at -5% or USD1743.22/Troy Oz.
