Gold has been corrective over the past month. This has come as the US dollar (USD) and US Treasury yields have rebounded. The two big factors that are historically so crucial the near to medium-term outlook for gold remain the key drivers right now. Subsequently, with the USD rally starting to falter, the corrective move on gold is trying to build support. This could now set up a choppy phase ahead for gold.
- Is there upside potential for yields and the dollar?
- The negative correlations with gold remain as strong as ever
- Technical analysis shows support is starting to develop on gold

Will yields and the USD continue to move higher?
Treasury yields bottomed in May the day after the latest FOMC decision to hike rates. In the subsequent weeks markets have moved towards a more hawkish pricing of the Fed funds rate. The US 10-year yield has moved to be between 25 and 50 basis points (bps) higher.
This has come as interest rate futures markets have moved to price in not only another rate hike but also to push the timing of rate cuts into 2024. According to the CME Group FedWatch tool, there is a 62% probability of another 25bps hike by July (the expectation is for a pause in June). However, equally as notable is that markets are pricing the probability of rates being below 5.00% (the current level) by the year-end as a 50/50 chance.
The Federal Reserve is having to weigh up the prospect of inflation that remains slow to reduce and a US economy that continues to have warning signs of a path towards recession. One more rate hike at the most sounds plausible in the summer. The historic average time for the Fed to wait before enacting rate cuts tends to be at least six months. This would suggest markets sitting on the fence of a December rate cut sounds fairly priced.
The big question is how all of this impacts Treasury yields and the dollar. Firstly, can yields continue to move higher? We have seen yields drop back after the US debt ceiling bill passed through Congress last week. Furthermore, the Fed rhetoric (before the blackout period began at the weekend) and the ISM data all point towards a less hawkish positioning. This may well now see yields settle at least until next Tuesday’s CPI data, with the FOMC decision a day later.
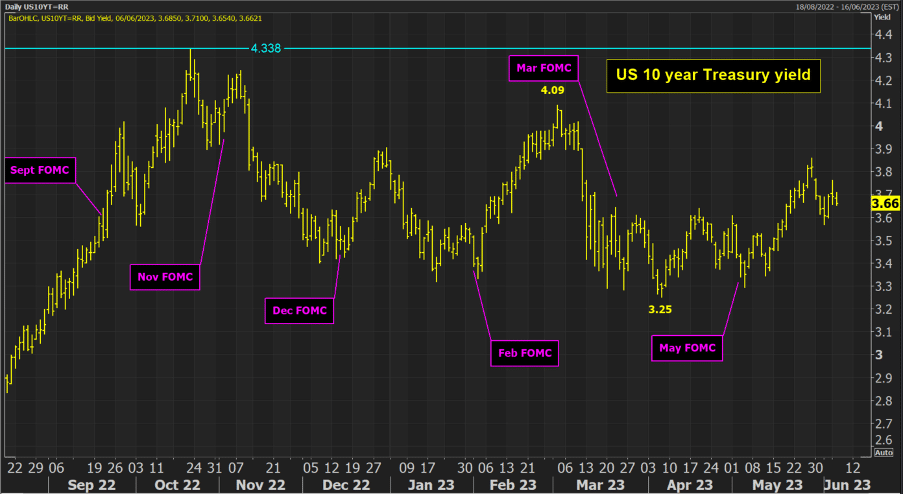
Yields are likely to now settle down. Last week’s high of 3.85% could be the limit of the near-term move higher. It would need a hot CPI and a hawkish lean from the Fed to push towards 4.00% now. More likely is the yield settling around 3.60% in the coming sessions.
Next to consider is the dollar rally. The Dollar Index has rallied strongly to break a long downtrend and establish what is now a multi-month trading range between 100.78/105.88. Trading above the mid-range pivot area between 102.80/103.45 gives it near-term support. However, the rally has just lost its way in the past week (coinciding with yields also tailing off).
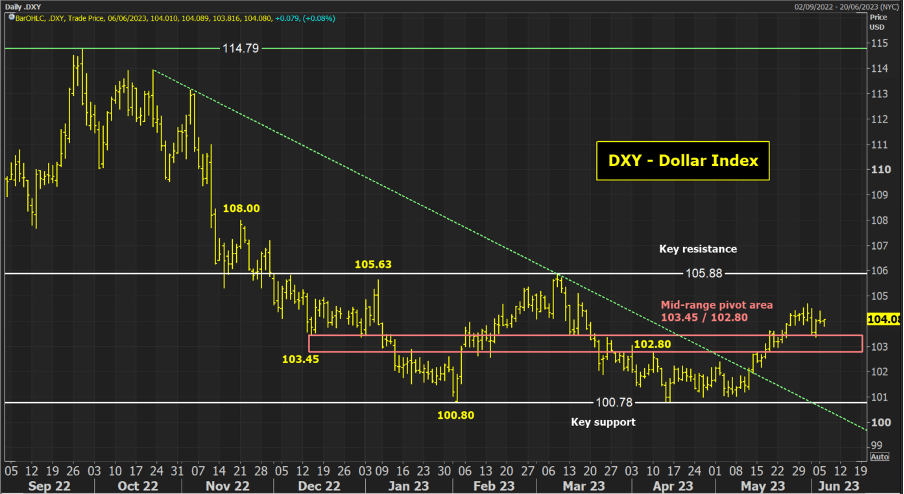
With resistance in place at last week’s high of 104.70, the Dollar Index looks set for a choppy phase between the pivot support band 102.80/103.45 and the resistance at 104.80. This could be the case at least until Tuesday’s CPI.
Gold set for a choppy phase
The correlations that gold has with yields and the USD remain as strong as ever. As I discussed earlier, nominal yields can still pick up, although I believe this is a move not likely to be seen until before the FOMC. However, looking at real yields (nominal yields accounting for inflation) the move higher is once more hitting up against an overhead barrier.
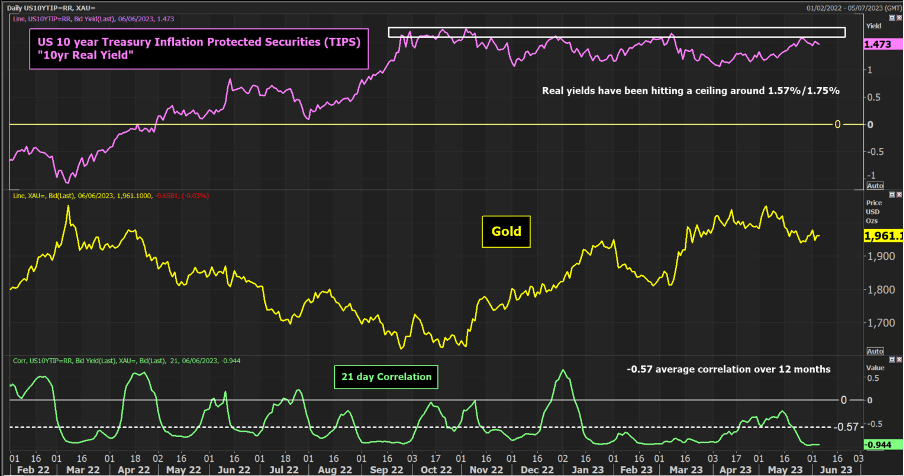
The US 10-year Treasury Inflation Protected Securities (TIPS) have struggled to overcome a barrier between 1.57% and 1.75% in the past eight months. Once more the yield has hit this level in the past week and tailed off. Given the strong negative correlation with gold, this could now begin to support gold.
The chart below shows an average correlation of -0.57 over the past 12 months but is currently around -0.94. This reflects the very strong negative relationship currently showing for gold and real yields. If yields are struggling to move higher, the correction on gold can build support.
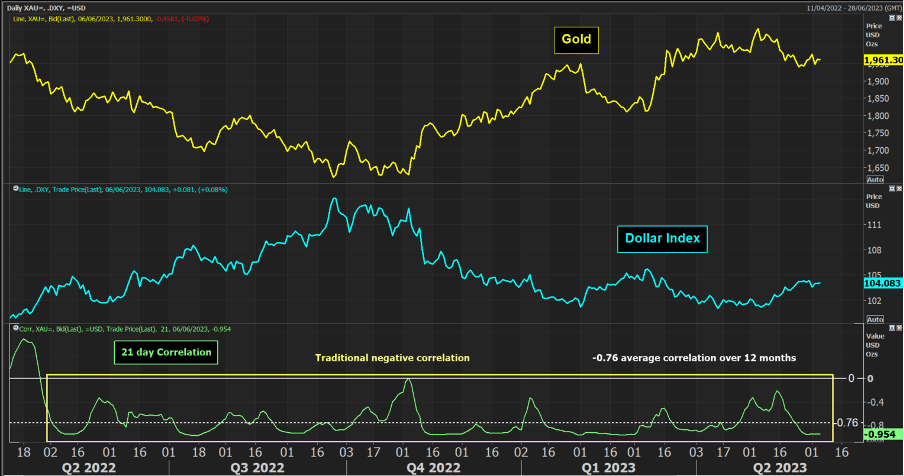
It is a similar situation with the USD too. On average, there is an even stronger negative correlation between gold and the USD (at -0.76 over 12 months). As the recent rally on the USD has tailed off, so gold has been building support. Both these relationships show that the outlook for gold remains tightly linked with yields and the USD.
Gold technicals at a key crossroads
Finally, if we consider the technical analysis of gold too, we see that the correction that I discussed previously has retreated into important areas of support.
The chart below shows that the unwind is back to the support of a seven-month uptrend. Also interestingly, when I draw in the Fibonacci retracement lines of the March to May rally, the recent lows between $1931/$1938 are pretty much bang on the 50% Fib. This seems to be a confluence of support around the bottom of the uptrend channel.
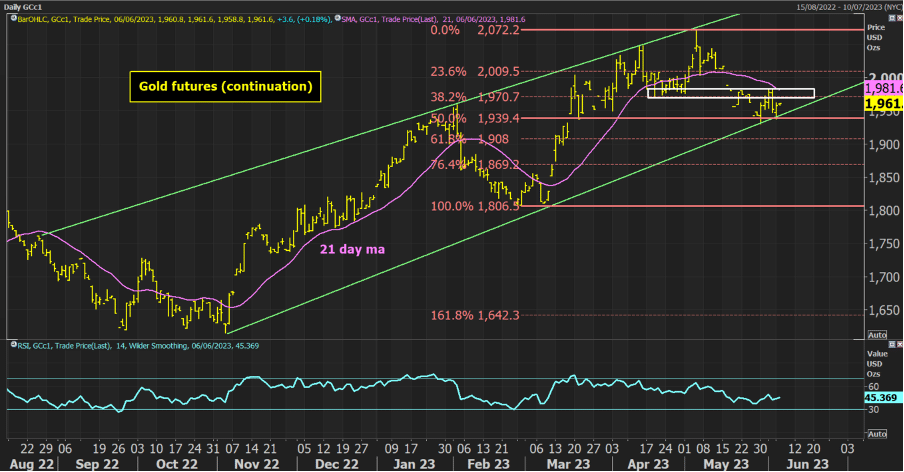
However, I am still aware that the resistance around $1970/$1983 remains intact and the 21-day moving average continues to fall with the price finding resistance underneath. This suggests that the near-term outlook is uncertain. This plays into what could now be a choppy near-term phase for gold. It would need a decisive move above the $2010 resistance or below $1931 support to open for the next move.
