Macroeconomic/ geopolitical developments
- On the Central Bank side last week, we had the Federal Open Market Committee (FOMC) Meeting Minutes released on Wednesday and Fed Chairman Powell spoke on Thursday.
- The FOMC Meeting Minutes and speech by Powell simply reiterated a still ongoing dovish stance.
- This has seen US yields retreat from multi-year yield highs seen in very early April.
- Having been closed for Good Friday on 2nd April, US equity markets responded positively throughout last week to the upbeat US Employment report for March that was released on Good Friday.
- The Non-Farm Payroll data far exceeded the anticipated number of 675K, posting at 916K.
- European equity markets and the Euro have been buoyed by the European vaccine programme getting on track, although it still lags the rollouts in the US and the UK.
- Some European nations are also lifting some lockdown measures, notably in Italy.
- The UK and US vaccination programmes are continuing at a high pace.
- Global financial market developments
- Global stock indices again hit yet new record and multi-month highs to start Q2, led by US averages.
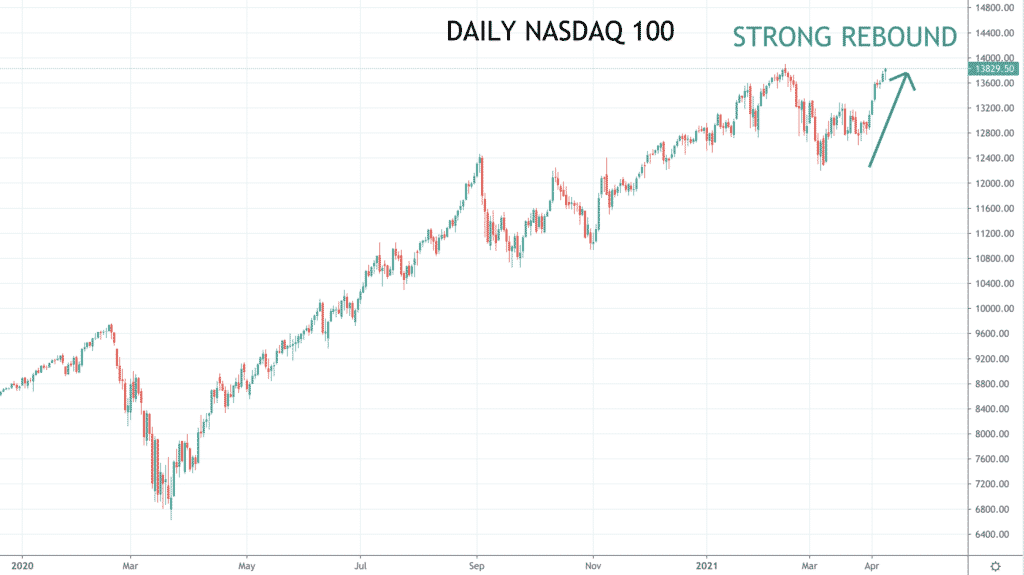
- The underperforming Nasdaq 100 and Composite averages have broken to the upside and although not a record levels, the bases that have been built on March provide a platform for a re-energized bull theme.
- European averages also saw a broad rally from late March extend into early April, with the FTSE 100 playing catch up and the DAX hitting another all-time high.
- The global bond market sell off eased last week, with US bond markets retreating from new multi-year yield highs.
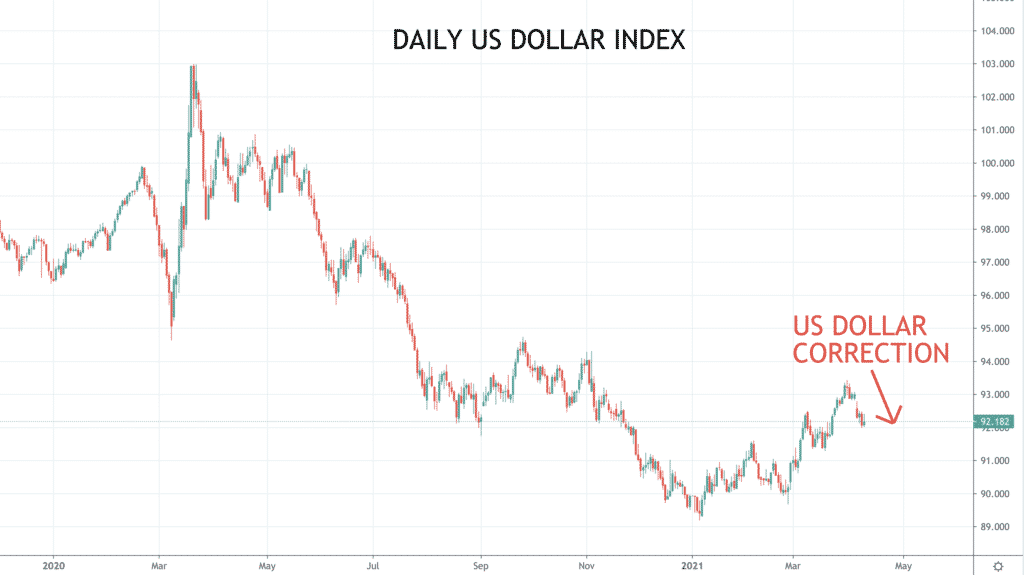
- The US Dollar has weakened within G3, lower versus the Japanese Yen and against the Euro, which has seen the Dollar Index slide lower in April.
- GBPUSD remains in a negative correction theme, with the positive aspects from the strong vaccine rollout fading.
- The “risk currencies” (the Australian, New Zealand and Canadian Dollars) have been mixed, but remain technically vulnerable versus the US Dollar into April.
- Oil has been sideways again last week.
- Copper has stayed sideways since its mid-Q1 correction lower from a multi-year high.
- Gold has bounced (with the US Dollar losses within G3), having held at the early March low in late March, indicating a potential chart base (Double Bottom).
Key this week
- Geopolitics:
- As always, traders need to monitor COVID-19 cases, hospitalisations and deaths globally (notably in Europe).
- Also watching for possible new lockdown restrictions or lockdown easings, particularly in Europe.
- Central Bank Watch: The Reserve Bank of New Zealand (RBNZ) interest rate decision and statement is on Wednesday.
- Macroeconomic data: This week brings notable inflation reports, with the Consumer Price Index (CPI) data from the US, Germany, and the EU. Plus, US Retail Sales and Chinese GDP, Retail Sales & Industrial Production (see the table below for details).
- Microeconomic data: Earning season starts in the US in earnest this coming week with the Banks and Financials. Standouts for the week are JP Morgan, Wells Fargo, and Goldman Sachs on Wednesday, then United Health, Bank of America and Citigroup on Thursday, whilst Friday brings Morgan Stanley’s results.
| Date | Key Macroeconomic Events |
| 12/04/21 | EU Retail Sales |
| 13/04/21 | Chinese trade data; UK GDP, Manufacturing & Industrial Production; German ZEW Survey; US CPI |
| 14/04/21 | RBNZ interest rate decision and statement |
| 15/04/21 | Australian Employment report; German CPI; US Retail Sales |
| 16/04/21 | Chinese GDP, Retail Sales & Industrial Production; EU CPI |
