- The top question right now is “What is the outlook for inflation?”
- The expectation is for higher prices in both the U.S. and U.K.
- The U.S. Manufacturing PMI data for May, out this week looks set to turn lower
- Look for the proof of higher lows on Monday as a reason to plug into cable
Looking across the global financial markets there is an underlying current of thought…maybe fear that the extensive levels of government stimulus to assist economies recover from the worst grip of COVID-19 will create an overheating. Such a scenario would be expressed by rising inflation.
What is the situation in the U.K. and U.S.?
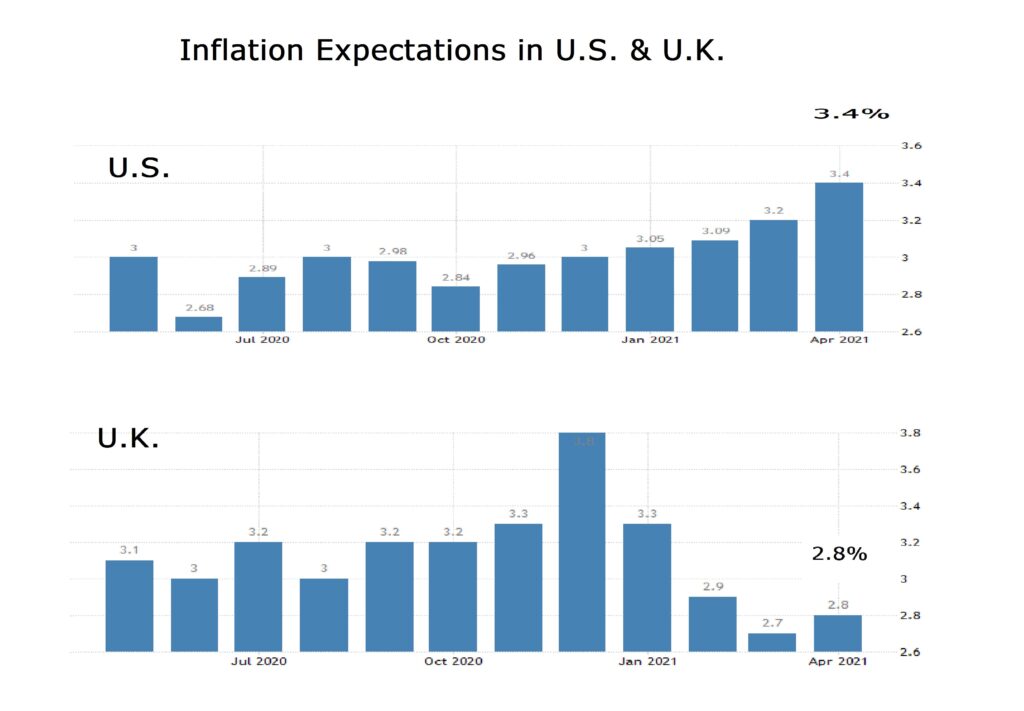
Figure 1: Inflation Expectations in U.S. & U.K.
Source: www.tradingeconomics.com, Federal Reserve Bank of New York, YouGov, Citigroup
Annual inflation rate in the U.K. edged up to 0.7% in March of 2021 from 0.4% in February and below market expectations of 0.8%. U.K. inflation is forecast to rise sharply in the coming months, due to increases in regulated household energy bills in April, pressure in global energy markets and a low comparison base as demand contracted in 2020 during lockdown.
Inflation expectations in the U.K. increased to 2.80% in April from 2.70% in March of 2021. Figure 1.
In the U.S. during April prices rose 0.8%, the most since 2009 while monthly core consumer inflation increased 0.9%, the most since 1996. This meant the median expected annual inflation rate in the U.S. rose to 3.4% in April. The highest forecast was 4.2% in April from 2.6% in March. This was in excess of the 3.6% forecast.
It was the highest reading since September of 2008, driven by rising demand as the economy reopens, soaring commodity prices and supply chain constraints.
Economic Evidence
The question that now arises is whether or not central banks will have to move away from the high level of accommodation they have used to cushion the economic fallout out from COVID-19.
Supporting the Dollar has been the view that recent key regional Purchasing Manager Indices (PMI) have beaten expectations:
- The Philadelphia Fed Manufacturing Index rose to 50.2 in April from a downwardly revised 44.5 in March and beating market forecasts of 42
- The New York Empire State Manufacturing Index rose to 26.3 in April from 17.4 in March, beating market forecasts of 19.5
The same is the case for the U.K.
- The IHS Markit/CIPS UK Manufacturing PMI was revised slightly higher to 60.9 in April, from a preliminary estimate of 60.7 and above March’s 58.9
In the U.S. rates traders are placing bets that the Fed may be forced to hike interest rates next year, much earlier than policy makers have indicated as the Consumer Price Index (CPI) increased to 266.83 points in April from 264.79 points in March of 2021.
However, once again the data from the U.K. matches the U.S. pattern as the CPI increased to 109.41 points in March from 109.10 points in February of 2021.
Figure 2 suggests that the market sentiment is looking for Sterling to experience a bout of early selling before finding its feet again over the week and the next month. That would confirm with the idea that GBPUSD is gently rotating without an impulsive channel that began at the start of May.
However, Figure 3 illustrates that the closing Spot on Friday, May 14 at 1.4096 was hammering once again on the door of the 50-Day Moving Average (50dma); a barrier that has rebuffed the Spot on several occasions this year.
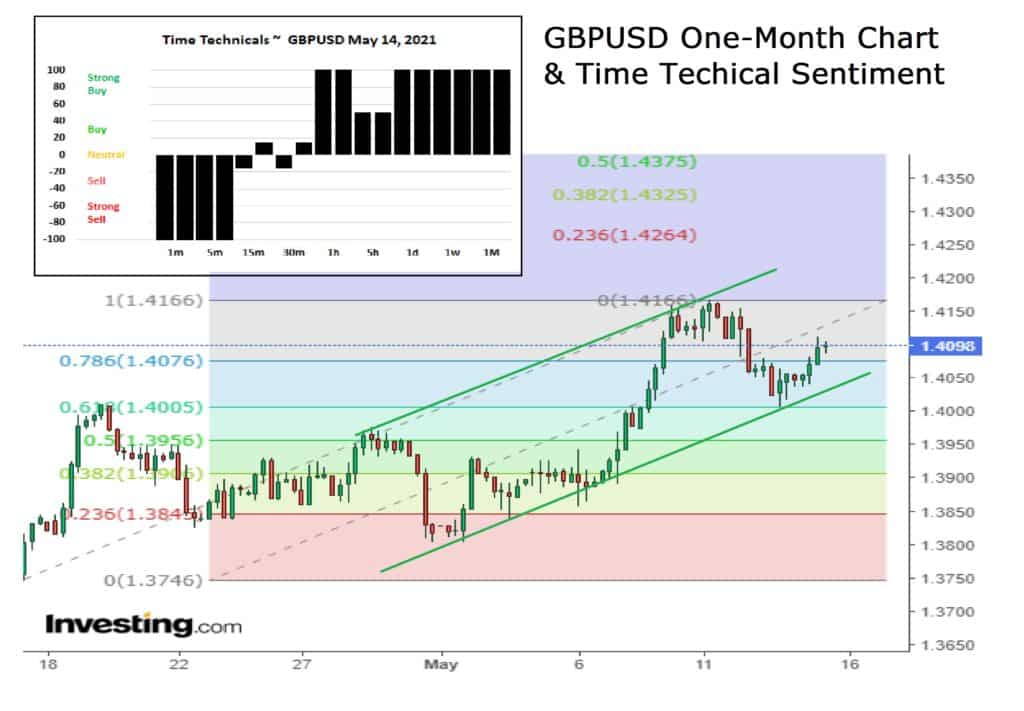
Figure 2: GBPUSD One-Month Chart & Time Technical Sentiment (Inset Chart) Source: www.investing.com, Spotlight Ideas
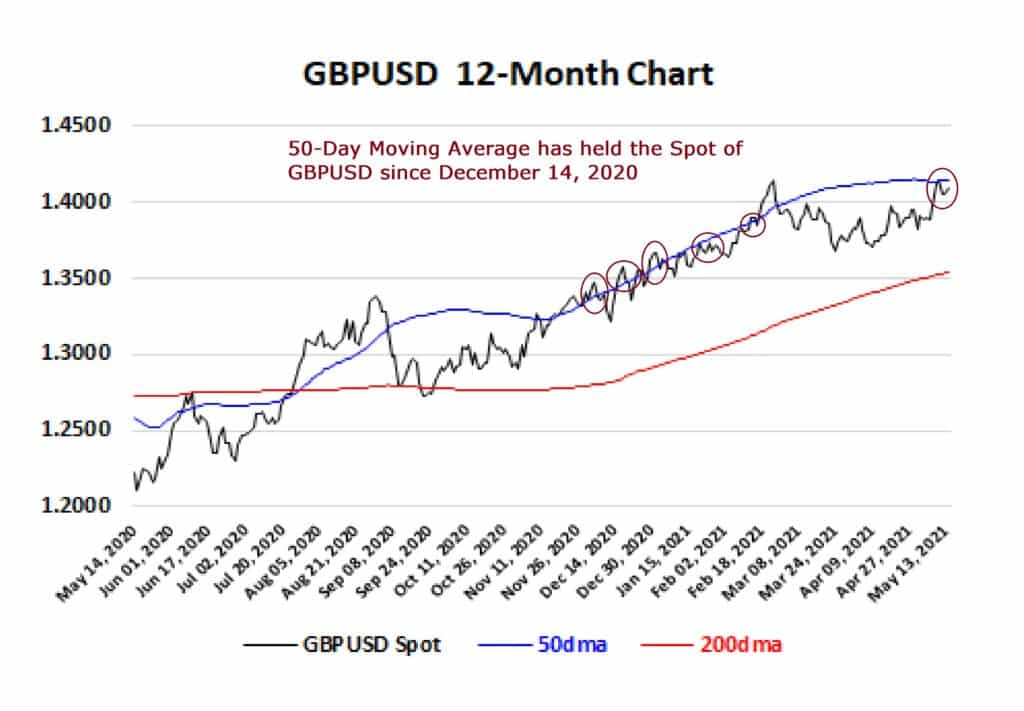
Figure 3: GBPUSD 12-Month Chart, 50dma & 200dma Source: www.investing.com, Spotlight Ideas
The time-based technical sentiment favours Sterling bulls. That said as Monday starts one would need to see a price print that establishes and affirms a series of well supported dips within any upward progression. In short, we need to see a series of higher lows.
If not, then sellers could be encouraged to try and push GBPUSD away from the 50dma and deeper into the channel as drawn in Figure 2. If this downward drive had any sense of momentum, then one could see the technical sentiment evaporate and the bears may gain traction to the base of the positive channel at 1.4050 cf. the close at 1.4096.
On Monday at 1330 BST (0830 Eastern) the May release for the New York Empire State Manufacturing Index will be released and expectations are posted at 23.90 so down from the 26.90 in April as referenced above. On Wednesday, the Fed minutes will be released and unless there is anything strangely hawkish, i.e. out of line with the publicly stated Powell position all attention will roll over to Thursday when the May series for the Philly Fed Index is released.
That is forecast to be only 43.0, again down from the 50.2 reading in April. Then what clinches me to be a cautiously optimistic buyer of GBPUSD is that on Friday, U.K. Manufacturing PMI in May will be steady at 60.7 whereas the full U.S. equivalent will narrowly shade lower at 60.4 cf. 60.5in April.
So I am buying GBPUSD after the first hour or so on Monday once I see higher lows develop.
I target 1.4150 and 1.4160 near-term and 1.4320 by the end of June. I set a deep stop at 1. 3540, the 200dma.
