Since hitting a high of $2072 in May, the Gold futures have been on the slide. There are signs though, in recent sessions that this move may be starting to find a low. However, building support is one thing, building a rally is something else. I have taken a look at what is driving this support and what is needed for gold to rally again.
- A continuation of less hawkish Fed-speak, with lower inflation also vital
- A reverse in US Treasury yields and a continued fall in the USD
- Technical indicators for Gold futures need to improve

More vocal doves and no upside surprises in the CPI will help
Undoubtedly, the noises out of the Fed have been hawkish in recent weeks. Despite holding rates steady in the June FOMC, the dot plots suggested two more hikes this year. This was backed up by Fed Chair Powell at his Congressional testimonies and the central banker get-together at Sintra. Hawkish FOMC minutes last week also suggested that “almost all” participants believed that more tightening was likely this year.
Markets have firmly priced in a hike in July and the potential for one more in September or November. Fed cuts are not expected until May 2024.
However, has there been a slight shift in the tide early this week? FOMC speakers who sit around the mid-ground on the spectrum of opinion on the committee have started to make comments alluding to the end of hiking. These less hawkish noises have impacted markets. Mary Daly (not a voter this year) suggested maybe two more hikes were needed but also that the Fed was nearing the end of “the last part” of hiking. She also says that the data will be key. Michael Barr (a permanent voter on the FOMC that sits pretty centrist) said that “I think we’re close”.
Now these comments do not represent a seismic shift, yet. However, after the volatility that saw US Treasury yields spike higher last week, started to unwind following the tepid Nonfarm Payrolls report, they are at least adding to the retracement. The US 2-year yield is back below 5% and the 10-year yield is under 4%.
All eyes will now be on the US CPI inflation data that is released on Wednesday. If inflation continues to be stubborn, markets will react to any upside surprises to pull yields higher again. However, as inflation trends in China continue to surprise lower, and strong comparatives drop out of the US MoM CPI, US inflation is set to fall much faster this month.
Seeing a sharp move lower on the CPI could add further momentum to the retracement in yields. Furthermore, some of the less hawkish voices on the FOMC could also become increasingly vocal once more.
High yields have not translated to USD strength
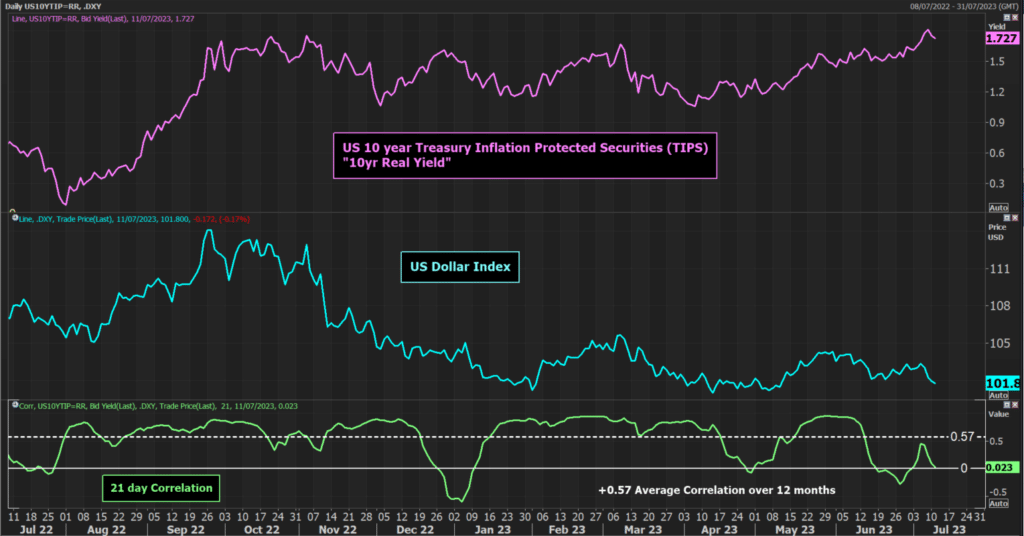
Treasury yields have rocketed recently. This is true of nominal as well as real yields. The US 10-year yield pushed above 4% last week which was the highest since March. With inflation expectations edging higher, but not matching this move, it has pushed the real US 10-year yield to break to levels above 1.75% to levels not seen since 2009.
Now, this should be USD-positive. Although the USD has been ticking higher in the past few weeks, the USD has failed to find significant strength from this enormous move higher in US yields. Now, with yields retracing, the USD is findings sharp selling pressure in recent sessions.
Now, it needs to be acknowledged that there could be extenuating circumstances here. As USD/JPY hit 145 last week (a level reportedly ready to trigger intervention), the Japanese yen has turned sharply to strengthen, particularly in recent days (likely to be as an unwind of the carry trade). However, still, the USD is also at multi-month lows against the EUR and the GBP too.
This is important for the formation of support for gold. Gold is generally driven by both real yields and the USD. However, according to historic correlations, when it comes to gold, the USD is in the driving seat. Despite an abnormal June where gold and the USD were both supported, the average correlation in the past 12 months has been a hugely negative -0.70.
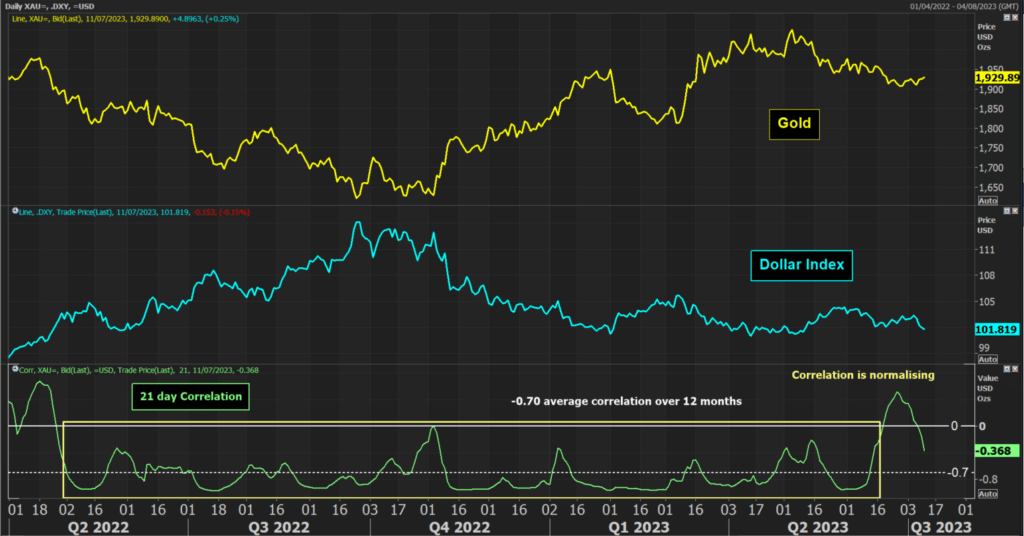
This suggests that if the USD continues to falter, then gold will build support but will also likely start to recover again too.
Improvements in the technicals are needed too
Looking at the chart of Gold futures, the reaction low posted at $1892 in late June is still holding. As this support has held the market is now looking to break the shackles of a two-month downtrend. However, breaking a downtrend does not mean a recovery is guaranteed, it might just be part of a consolidation phase. For a decisive recovery to form, there are several aspects of the technical analysis of gold that need to improve:
- Higher lows and higher highs need to form – resistance is still restrictive overhead. This is a band between $1932/$1941 that were previously old lows and has become new highs. This overhead supply of sellers needs to be overcome. A higher key low above $1892 is also needed. This would be the building blocks of a recovery trend.
- A confluence of resistance needs to be broken – Along with this band of price resistance, there is also the 50% Fibonacci retracement (of the $1806/$2072 rally) at $1939 and the falling 21-day moving average at $1931. Both of these add to a confluence of resistance.
- An improvement in momentum is needed – the consistent failure of the relative strength index (RSI) under 50 reflects a market that is still stuck in “sell into strength” mode. This needs to change. The RSI moving consistently above 50 would imply a shift to a more positive momentum.
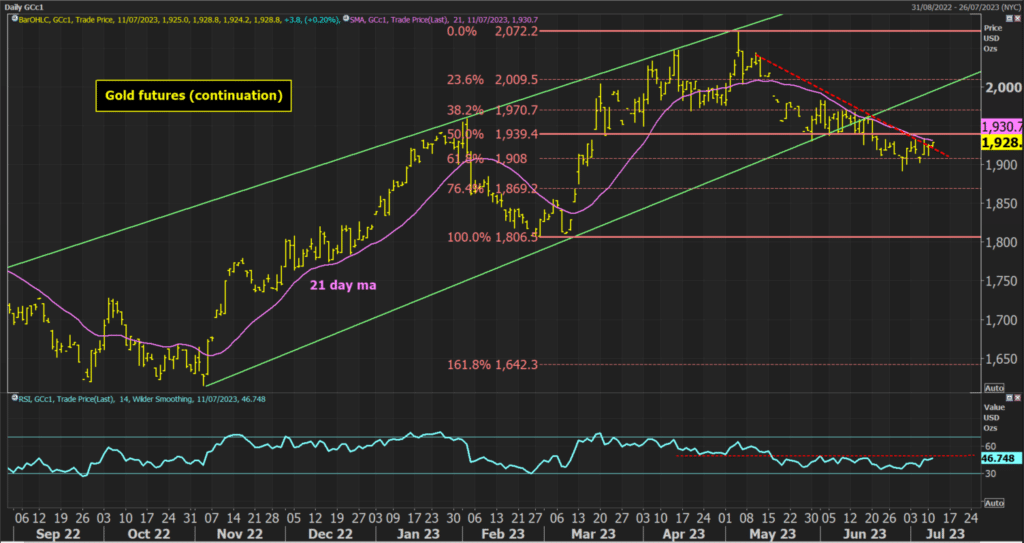
If the resistance at $1941 can be broken then it would open upside towards the next resistance band between $1970/$1983.
