In this Master Academy educational video and article, we are looking at Charts Patterns, focusing on Reversal Patterns.
Charts Patterns
- A chart pattern is a distinct formation on a chart that signals potential for future price movements
- Technical Analysts use these patterns to identify current trends, trend reversals and for buy and sell signals
- There are two types of patterns, Reversal and Continuation
- In this article and accompanying video we will be looking at Reversal patterns
Reversal Patterns
Examples of major Reversal patterns are:
- Double Tops
- Double Bottoms
- Triple Tops
- Triple Bottoms
- Head & Shoulders
- Inverse Head & Shoulders
Double/Triple Tops & Bottoms
- These patterns are formed after a sustained trend
- They signal that the trend is about to reverse
- These patterns are created when price tests resistance or support (twice for Double and three times for Triple) but cannot break through
- A bottom is completed when price moves above the interim peak for a Double/Triple Bottom
- A top is completed when price moves below the interim low for a Double/Triple Top
- A price target is calculated by measuring between the peaks/troughs and the interim level, projected from the breakout
- This price target is called the Minimum Price Objective or MPO
Double Bottoms

Double Tops

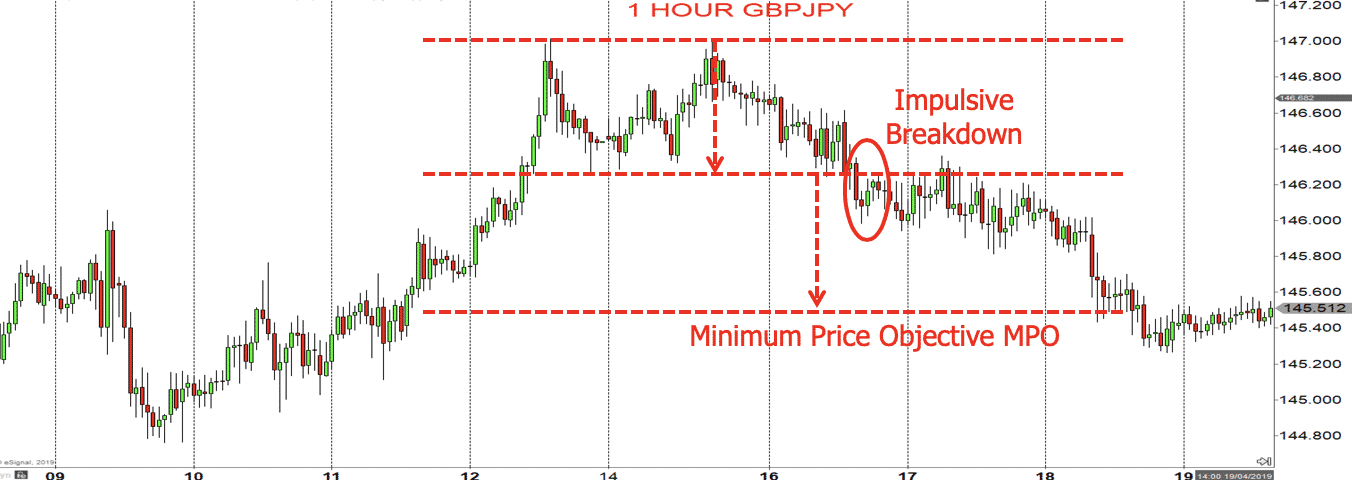
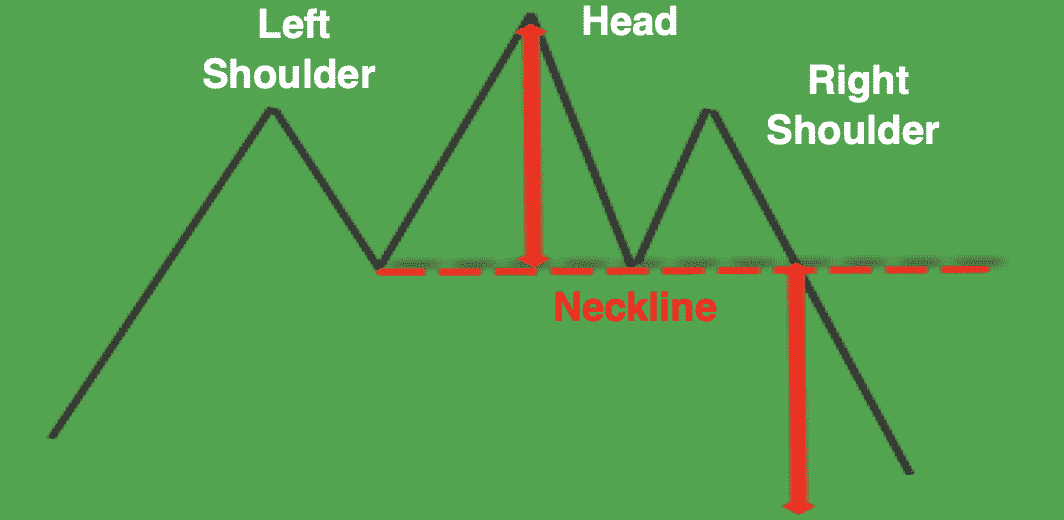
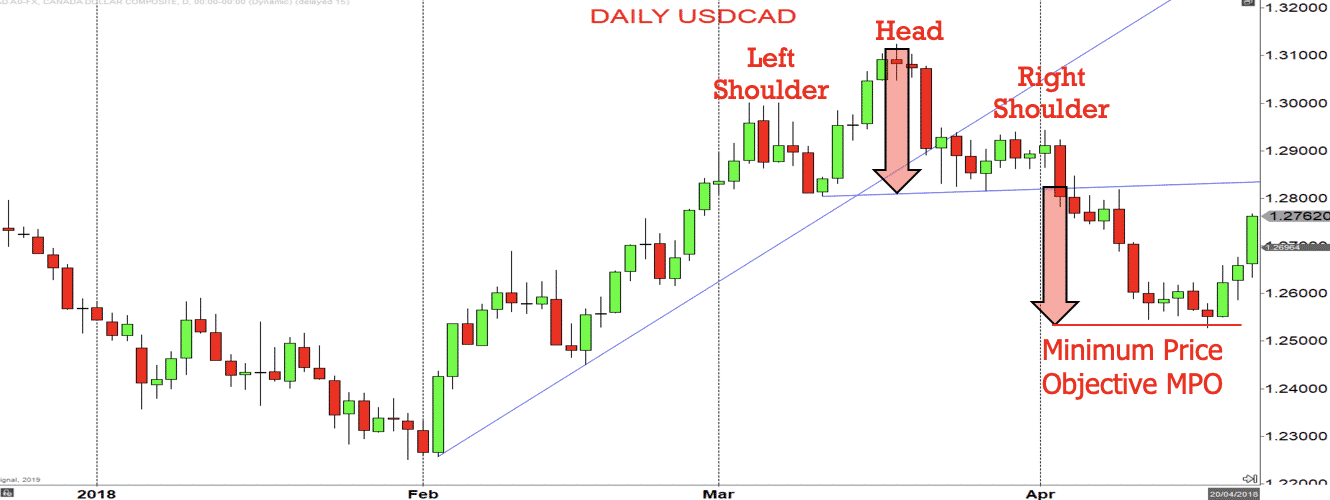
Head & Shoulders Top pattern
- A Head & Shoulders Top is a bearish reversal pattern
- It requires a prevailing up trend
- The Head & Shoulders Top contains three successive peaks
- The middle peak (Head) is the highest and the two outside peaks (Shoulders) being lower and roughly equal
- The reaction or swing lows of each peak are connected to form a “Neckline”
- The “Neckline” can slope up, slope down or be horizontal
- If the “Neckline” is broken, The Head & Shoulder Top is complete, and the up trend is reversed
- The Minimum Price Objective (MPO) for the Head & Shoulder Top is the height of the Head from the Neckline, projected down from the break of the Neckline
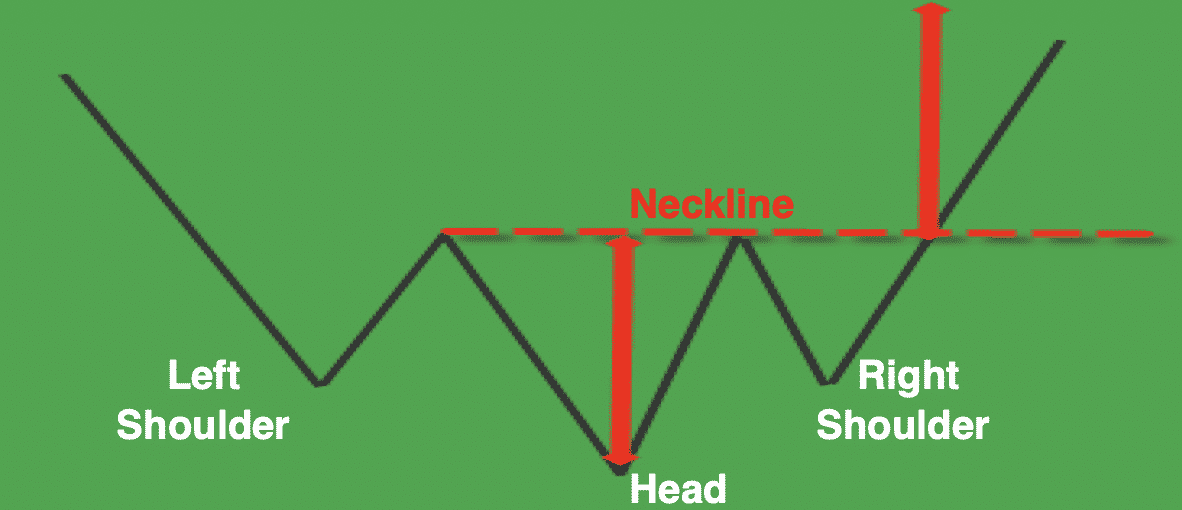
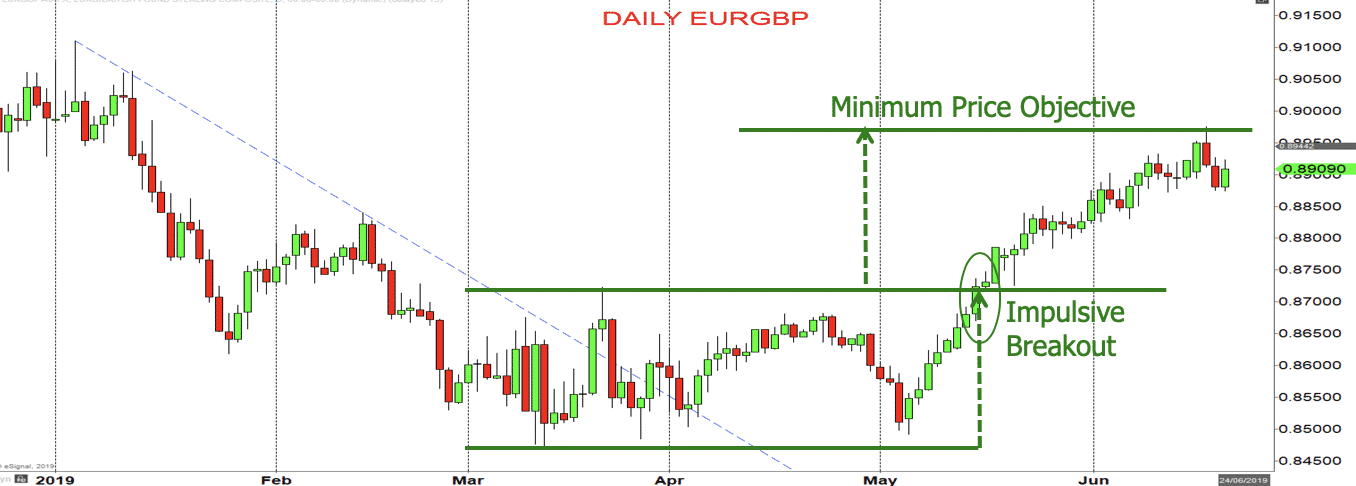
Inverse Head & Shoulders Bottom patterns
- A Head & Shoulders Bottom is a bullish reversal pattern
- It requires a prevailing down trend
- The Head & Shoulders Bottom contains three successive troughs
- The middle peak (Head) is the lowest and the two outside peaks (Shoulders) being higher and roughly equal
- The reaction or swing highs of each peak are connected to form a “Neckline”
- The “Neckline” can slope up, slope down or be horizontal
- If the “Neckline” is broken, The Head & Shoulder Bottom is complete, and the down trend is reversed
- The Minimum Price Objective (MPO) for the Head & Shoulder Bottom is the height of the Head from the Neckline, projected up from the break of the Neckline