In this Master Academy educational video and article, we are introducing at the basic concepts of Support and Resistance.
Support and resistance represent key junctures where the forces of supply and demand meet.
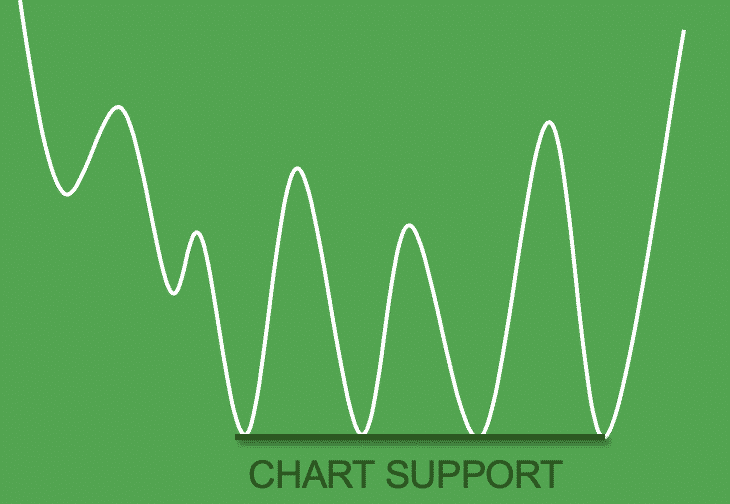
Support
- Support is the price level at which demand is thought to be strong enough to prevent the price from declining further
- A Chart Support level is formed when a large number of buyers want to buy at the same price
- The sellers are unable to push the market price down through the Chart Support
- Investor demand overcomes supply (or the market runs out of sellers)
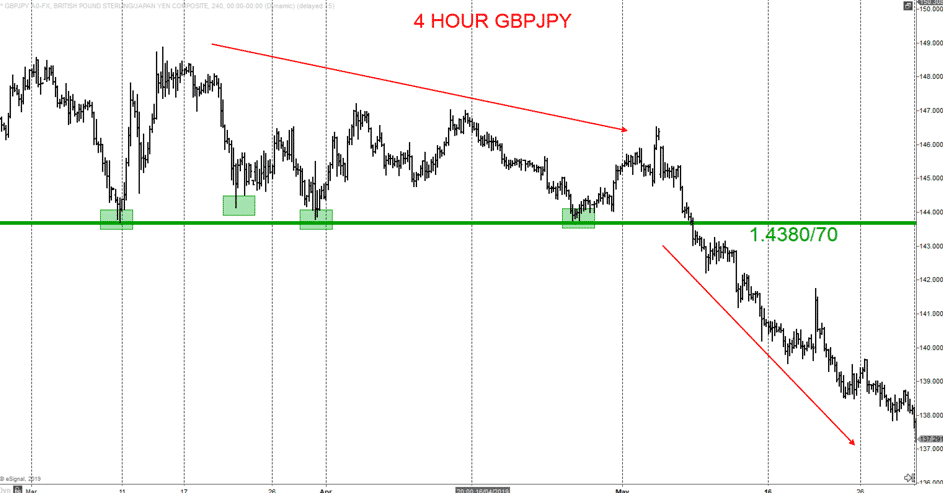
- Support does not always hold and a break below support signals that the bears have won out over the bulls
- A decline below support indicates a willingness to sell and/or a lack of incentive to buy
- Support breaks and new lows signal that sellers have reduced their expectations and are willing to sell at lower prices
- In addition, buyers could not be coerced into buying until prices declined below support or below the previous low
- Once support is broken, another support level will have to be established at a lower level
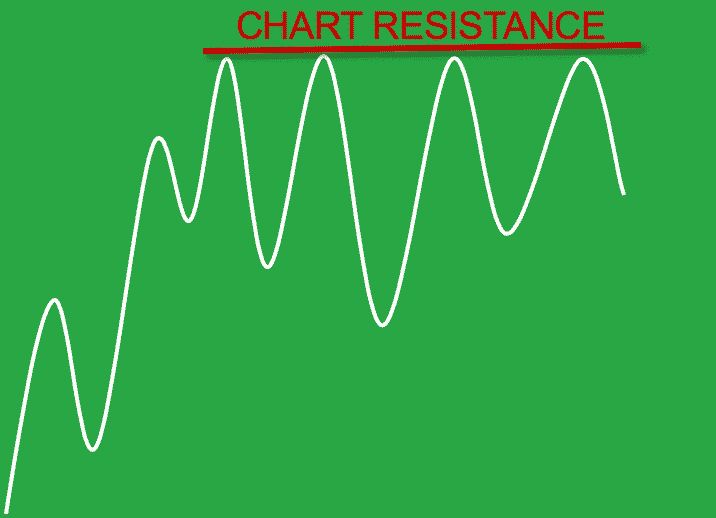
Resistance
- Resistance is the price level at which selling is thought to be strong enough to prevent the price from rising further
- A Chart Resistance level is formed when a large number of sellers want to sell at the same price
- The buyers are unable to push the market price up through the Chart Resistance
- Investor supply overcomes demand, or when the market runs out of buyers
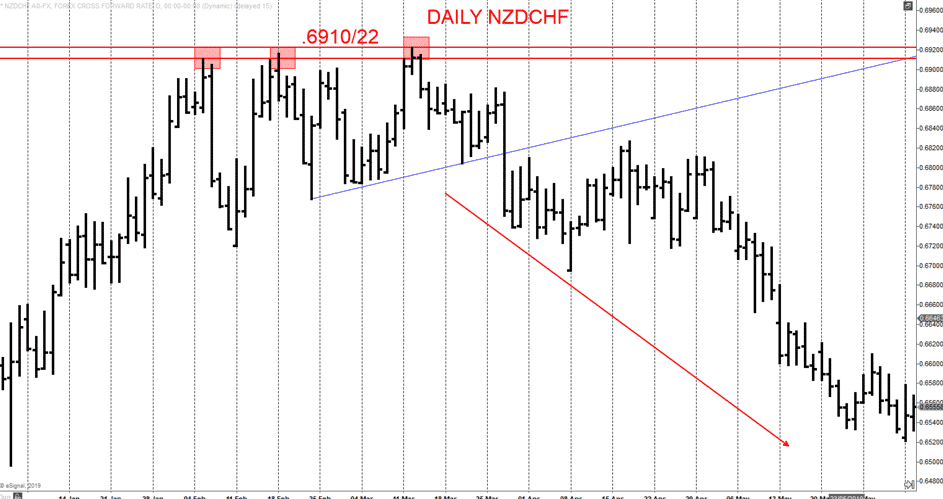
- Resistance does not always hold and a break above resistance signals that the bulls have won out over the bears
- A break above resistance shows a new willingness to buy and/or a lack of incentive to sell
- Resistance breaks and new highs indicate buyers have increased expectations and are willing to buy at higher prices
- Once resistance is broken, another resistance level will have to be established at a higher level
- In addition, sellers could not be coerced into selling until prices rose above resistance or above the previous high
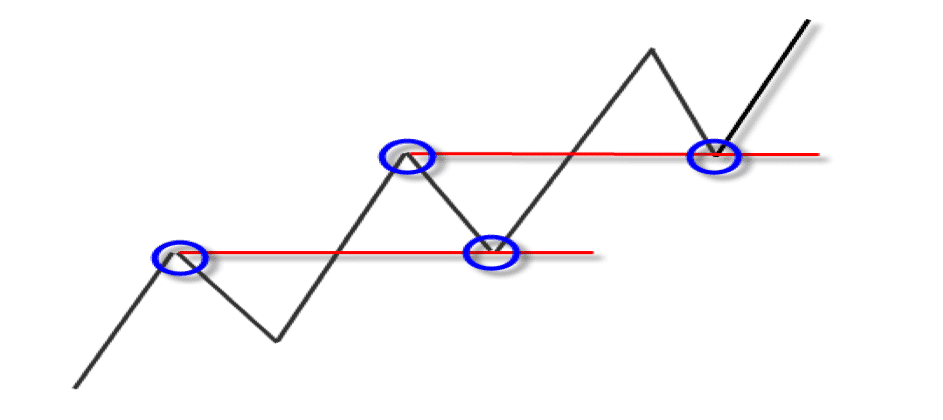
Support into Resistance/ Resistance into Support
- Another principle of technical analysis stipulates that support can turn into resistance and vice versa
- Once price breaks below a support level, the broken support level can turn into resistance
- A support break signals that the supply forces have overcome the demand forces
- If the price returns to this old support level, there is likely to be an increase in supply, and hence resistance
- Conversely, resistance can turn into support
- The breakout above resistance proves that the forces of demand have overwhelmed the forces of supply
- If price returns to this old resistance level, there is likely to be an increase in demand and support will be found

Great article! Do you believe that support-resistance levels could be used alongside supply-demand zones? Or is it a case where one should choose one or the other?
Keen to hear your views on this!
Many thanks for the positive feedback and great question. Support and resistance levels and supply and demand zones can be used together, as long as you have a definitive way of locating those supply and demand zones.
Market profile would be a great way to do this.