The concept of support and resistance
The interaction between buyers (demand) and sellers (supply) is a crucial aspect of how prices move in financial markets. Which side is dominant determines whether a price will move higher or lower. However, when the balance of dominance shifts between the buyers and sellers, this is when markets change direction and can post important turning points.
Support and resistance are formed at the key turning points in the price. Important price highs become resistance, whilst important lows act as support. Traders will use support and resistance levels as gauges for the outlook of a market. If important levels of support or resistance are broken it suggests a change in the outlook.
Support and resistance levels and areas
It is important to understand that technical analysis is an art, not a science. Equally, financial markets can contain a huge pool of buyers and sellers. Subsequently, support and resistance are not always around exact levels.
Traders will react differently around important levels. This can create zones or areas of support and resistance. Traders need to understand this when setting stop-losses and profit triggers.
Support
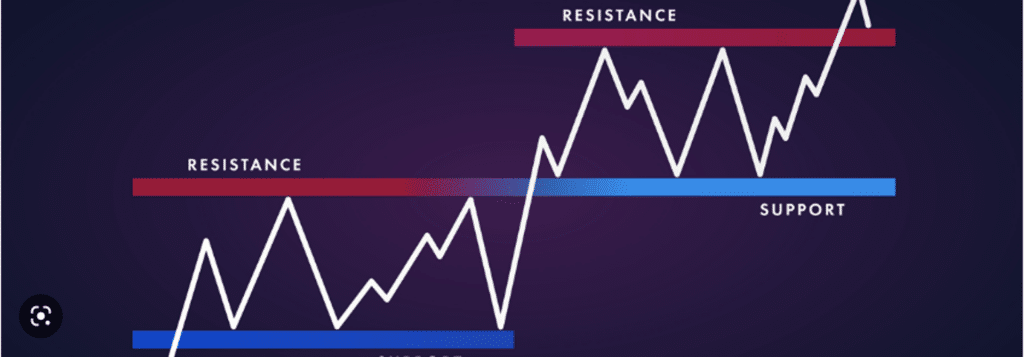
If the level of supply (willing sellers) is greater than the level of demand (buying pressure), the price will be falling. However, with the price becoming ever cheaper, the level of demand will begin to increase relative to supply. As demand starts to outstrip supply, the price will bounce from a low and begin to rise. This low is seen as support.
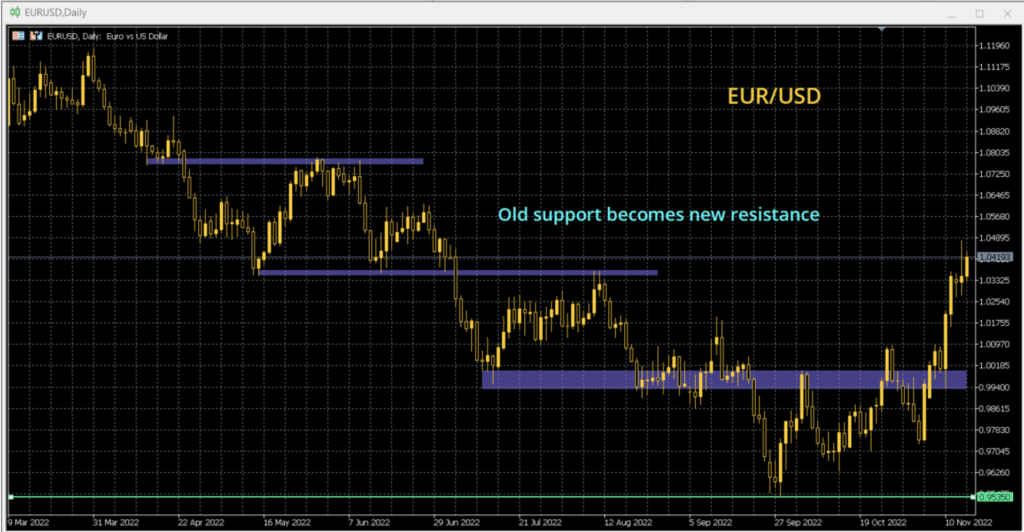
We also see that in an uptrend phase, old resistance will become new support. The traders that had been willing to sell at the old resistance see a change in the outlook on the breakout. The traders that are running short positions now at a loss, will see a return to the old resistance as an opportunity to close their positions (i.e. buy it back) for minimal or no loss. This level subsequently turns into new support.
Resistance
When the demand (buying pressure) is greater than the supply (willing sellers) the price levels are pushed higher. However, the higher the price, the more willing traders are to sell. When the volume of selling pressure exceeds the buyers, the price will stop rising and begin to fall. This price becomes a level of resistance.
However, we can also see resistance forming as the market falls. When old levels of support are broken during a selling phase, this marks a shift in the outlook. Old stale bulls that had previously been buyers around the support now see their positions running at a loss. They would then see any rebound towards the old support as an opportunity to close the position for minimal losses. The old support has become new resistance.
Looking for volume confirmation
When support or resistance is broken, there is always the question of whether the breakout can be trusted. One indication is to look at the traded volume around the breakout.
Decisive breaches of support and resistance should be confirmed with an increase in volume. The flurry of trading activity on the breakout can reflect a shift in market sentiment.
Indicators to use with support and resistance
Several technical analysis tools incorporate the concept of support and resistance into their methodology. Here are a few to look at:
- Trendlines – Uptrends and downtrends can act as important gauges of support (in the case of an uptrend) and resistance (in a downtrend). Also, just as old support becomes new resistance, once trendlines are broken, they can flip to become the opposite. The underside of a broken uptrend can become resistance, whilst a broken downtrend can act as support.
- Moving Averages – These act as fluid gauges of a trend in the price. As such, similar to trendlines they can also act as support or resistance.
- Fibonacci – Fibonacci levels can act as important consolidation and turning points for markets.
- Psychology and round number levels – Round number levels can act as important gauges of support and resistance, especially when trading breakouts and breakdowns. This is because options positions will often sit at round numbers.
