In this Master Academy educational video and article, we are introducing the concept of Trend, Trendlines and Channels.
What is Trend?
Markets tend to move in a general direction or trend
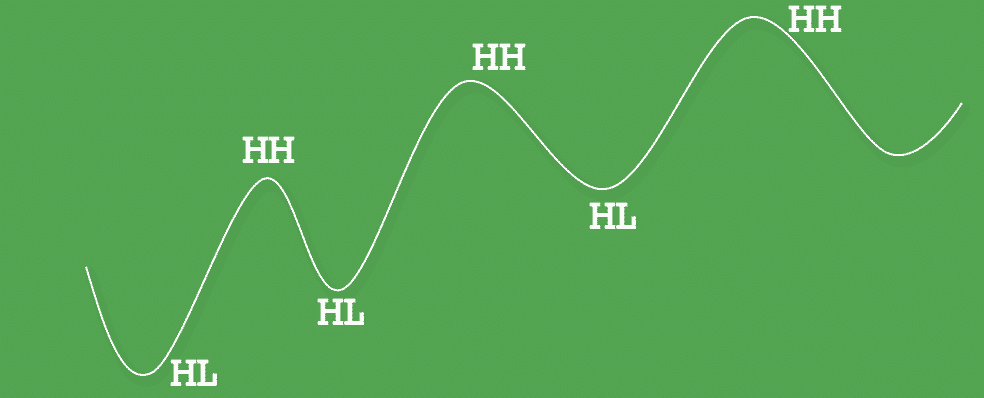
An Up Trend
- An up trend is a sequence of higher highs and higher lows
- In an up trend, price will rally to a high (peak), then sell off to a low (trough)
- A market in an up trend has each peak in the rally reaching a higher level than the previous peak
- Each low in the rally must be higher than the previous rally low
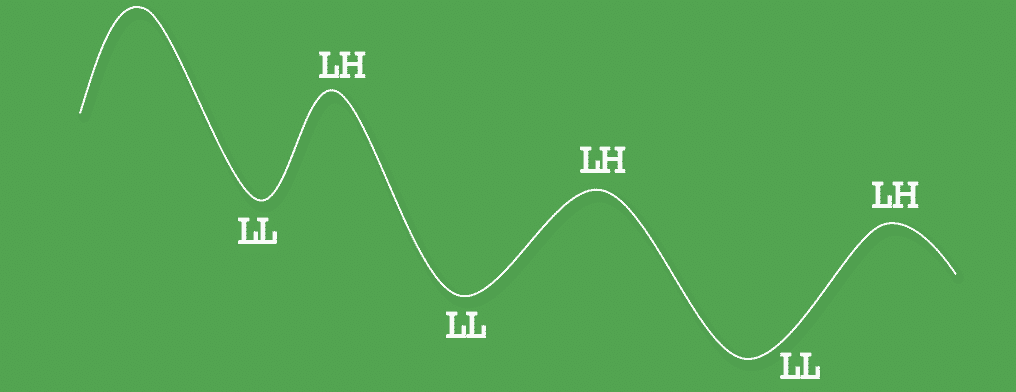
A Down Trend
- A down trend is a sequence of lower highs and lower lows
- In a down trend, price will selloff to a new low (trough), then rally to a high (peak)
- A market in a down trend has each low in the selloff reaching a lower level than the previous low
- Each high in the selloff must be lower than the previous selloff high
Trend Lines
- Technical analysis is built on the assumption that prices trend
- A trend line is a straight line that connects two or more price points to represent the trend in the market
- The Trend line extends into the future to act as a line of support or resistance
- Trend lines are used to show trend direction and critically used in the identification of trend extension or reversal
- The more points used to draw the trend line, the more valid is the support or resistance represented by the trend line
Up Trend Line
- An up trendline is drawn off the lows of an upward trend
- It has a positive slope
- It is formed by connecting two or more low points
- Then with a third, confirming touch
- This line represents the market support every time it moves from a high to a corrective low
- As long as prices remain above the trendline, the uptrend is considered solid and intact
- A break below the uptrend line indicates that the trend has weakened and a change in trend could be imminent

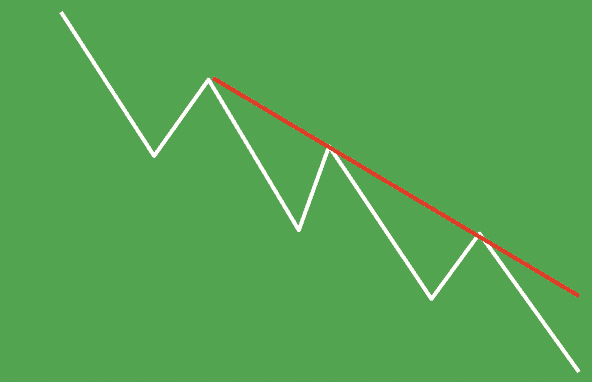
Down Trend Line
- A down trendline is drawn off the highs of an downward trend
- It has a negative slope
- It is formed by connecting two or more high points
- Then with a third, confirming touch
- This line represents the market resistance every time it moves from a low to a corrective high
- As long as prices remain below the trendline, the downtrend is considered solid and intact
- A break above the down trend line indicates that the trend has weakened and a change in trend could be imminent
Channels
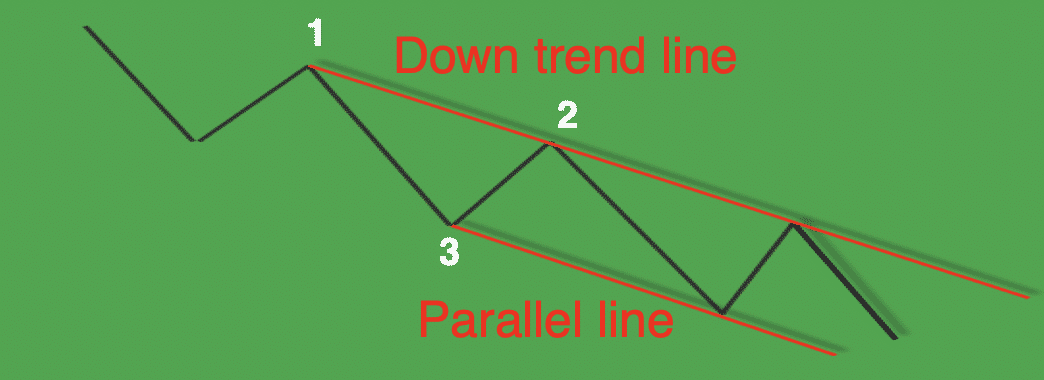
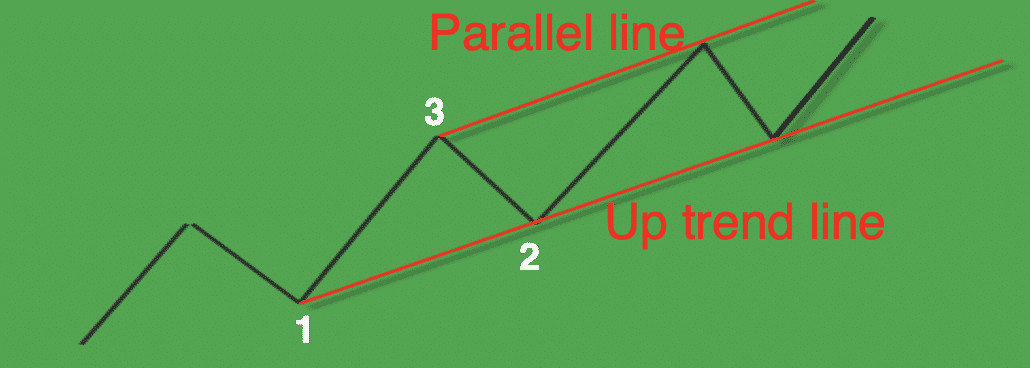
- A channel is a parallel line drawn in relation to either an up or down trend line
- This parallel line, should be drawn off the first, notable reaction high in an up trend and reaction low in a down trend
- In the examples below, the trend line is first drawn between points 1 and 2.
- Then, the channel is a parallel line to the trend line and placed at the swing high or low between points 1 and 2, point 3.
Up Channel
Down Channel