- Since the 1960’s supply chains have gone global
- Cost control and profitability were key drivers
- Coronavirus has crashed the global economy
- There is a new drive to build local chains
In the traditional teaching of economic theory, the argument suggests that global GDP will increase when the principle of comparative advantage [1] is applied by countries to determine what goods and services, they should focus on or specialise in producing.
The concept suggests nations should consider what goods and services they should produce and thereby specialise via creating an allocation of their resources [2] to produce goods and services in the areas where they enjoy a comparative cost advantage.
At the outset one must understand the difference between “Absolute” and “Comparative” advantage.

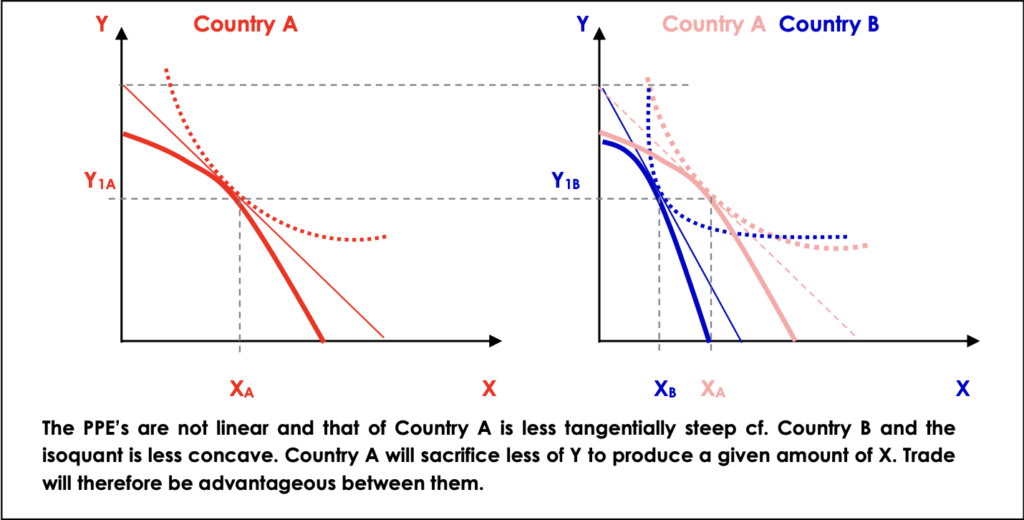
In the simple model two countries that can produce two goods will consider the trade-off ratio between those goods, i.e. the gradient of their respective production possibility frontiers (PPF).
However, the simple theory just considers substituting production of one good for another with perfect substitution of factor inputs. Hence the PPF is drawn as linear.
The reality is that nations, or more accurately, the producers within any given nation must consider:
- Dimensionality; the number of goods and factors
- Factor mobility
- Competition for factors
- Relative technologies and efficiency
- Factor endowment
- Demand similarity
These points are captured by the Stolper-Samuelson theorem [3] for the relationship between factor and output prices and the Rybczynski Theorem [4] that links output levels to factor supplies, given end prices for output.
Commodity prices are not always available to all parties at the same time or the same price, nor are labour costs or technologies equal in efficiency. So, at any given time, differing nations will not only face different gradients to their respective PPE, the convexity or “cone-shape” of producer isoquants will also be vary.
Supply Chains…Global Complexity
The pattern of global economic development since the 1950’s has been for supply chains to slowly but steadily become increasingly international, indeed global. That has been the impact of each nation encouraging its producers to specialise and take advantage of increased complexity and multi-party composition of global supply chains. The trade that arises may be in raw materials, semi-finished and finished goods.
Producers have also been active in keeping the manufacturing cost under their control as such they have outsourced operations from high-cost locations to those of lower cost. In fact, many operators have looked to always be seeking the cheapest location; in effect they use dynamic outsourcing.
This relentless drive to locate the most advantageous “low-cost country sourcing” (LCCS) led to the large-scale unbundling of production in terms of both location and processes. This has resulted in complex global supply chain ecosystems.
Most corporations specialise in a small range of core competencies and can use outsourcing of production processes, in which they are not competitive. This is done globally through attraction of the companies from other countries that can provide competitive production, [5].
As an example, consider Nutella, made by Ferrero SpA. Figure 2 illustrates the fact that to produce Nutella, Ferrero SpA uses a truly global supply of value chain, (GSC or GVC).
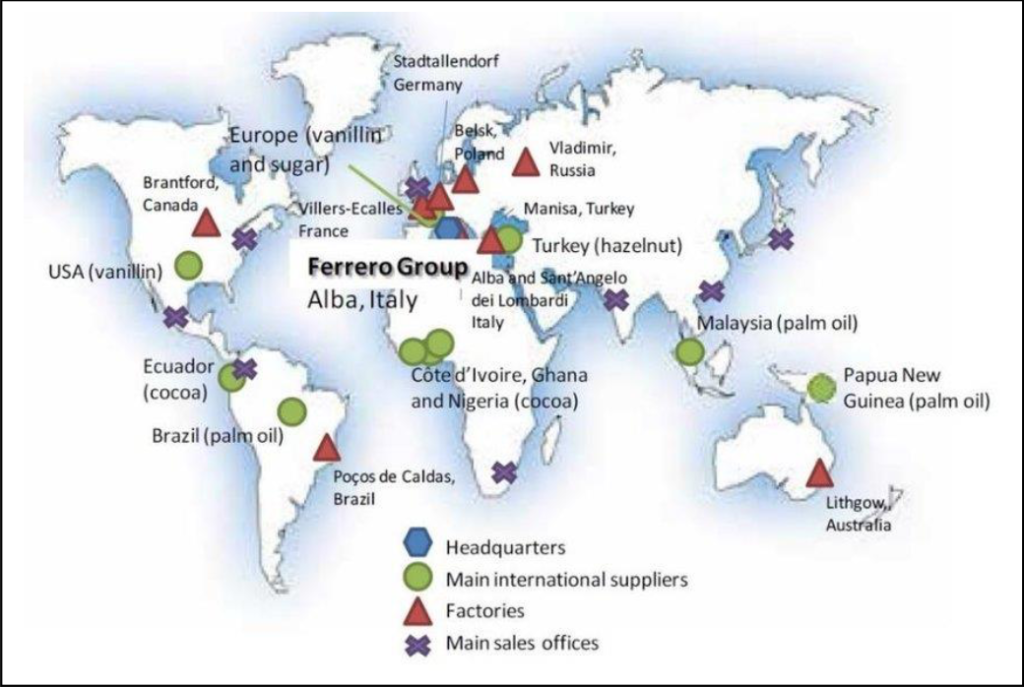
The Nutella example demonstrates that to build an understanding of the intricate nature of global production is not a straightforward exercise.
Up until the end of 2019 we lived in a world of seemingly relentless offshoring, outsourcing and vertical specialisation. If one examined the published accounts or security listing documents of any medium to large corporation one could see that operations were spread across countries on a continental if not global basis.
The concept of GSC/GVC first gained traction in the 1950’s and 1960’s and was the heart of the drive to move production to exploit LCCS and enjoy economic efficiency. It was a critical driver of global growth, rapidly becoming part of the modern worlds DNA leading to:
- Increasing fragmentation of production across countries
- Interconnectedness of economies
- Specialisation in tasks and business functions
- Global consumers buying products best describes as “MADE ON EARTH”
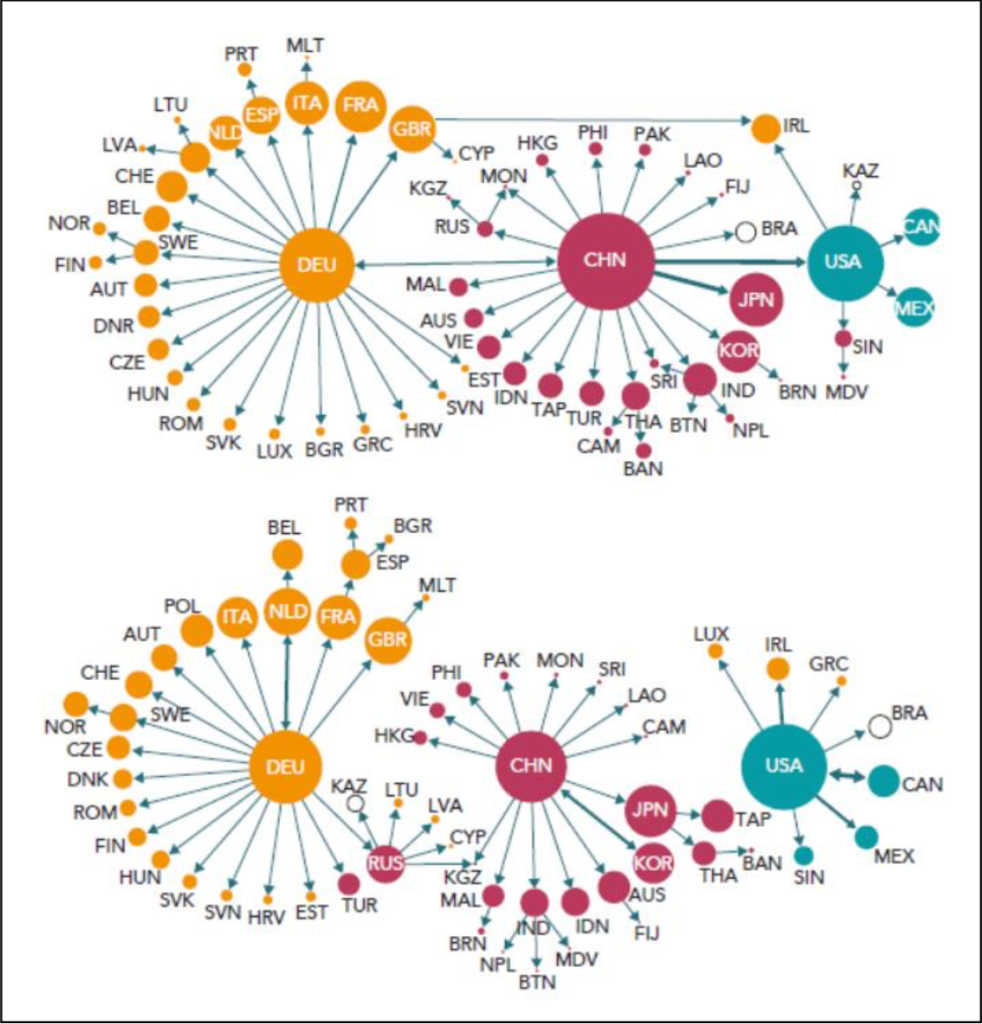
This has allowed a greater, more insightful analysis of the relationship between global buyers and global suppliers, i.e. a consumer driven network of production that determines which economic agents control and coordinate production and distribution.
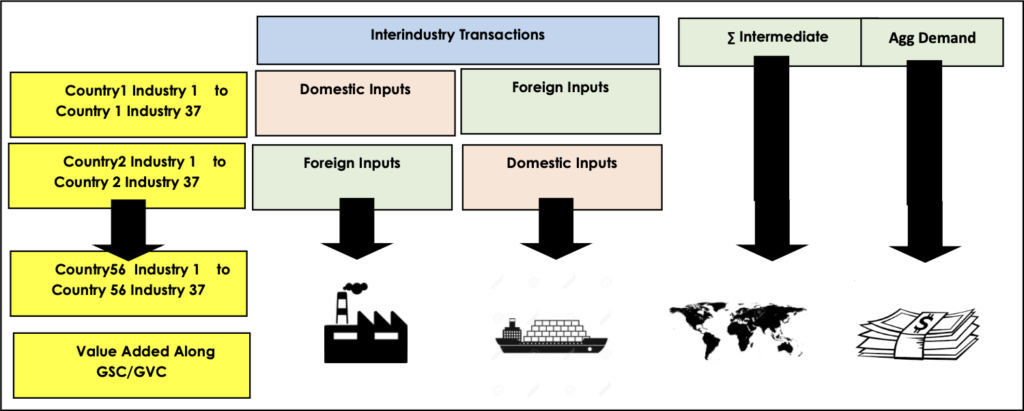
We can access data from the Organisation for Economic Cooperation and Development (OECD) to cover 56 counties and 37 sectors [6].
Chain Length
To estimate the length of GSC/GVC one can deploy an input-output matrix within the interindustry, international framework as shown in Table 2. This is calculated as an index:
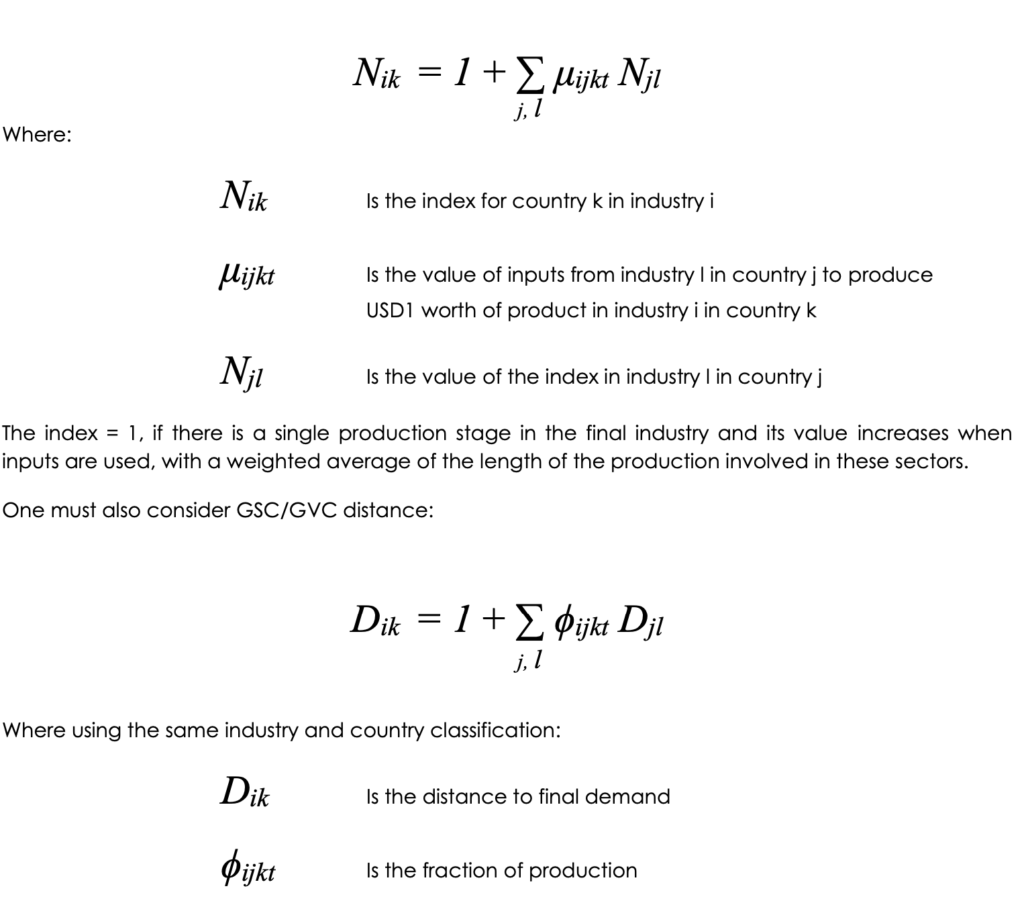
The results show that small, open economies must source more inputs from abroad than large countries, where due to the size to the economy a greater share “could” be produced domestically.
However, such has been the drive to embrace globalisation and outsourcing as a way of controlling costs, hence boosting the bottom line. The length of supply chains has increased in the last decades.
Driven by cost leadership, outsourcing at a global level has stretched the supply chain up to seven tiers. One must ask how reliable is the GSC/GVC? Can companies really control such a lengthy supply chain?
Those far away seven tiers tend to be small production companies where communication is difficult. Of course, language and cultural differences adds to the complexity and real time information is hard to come by. In short, delivery time has always been a risk.
For the U.S. where the trade deficit has deepened since 1975 less than 10% of the value of exports is made of foreign value-added, while taking into account the use of intermediates in other countries exports and their participation in GSC/GVC’s rises to more than 40% of gross exports. In contrast, China has a far lower share of exports made of inputs from overseas.
The amount of foreign value added does not directly imply a long GSC/GVC as a large share of foreign value-added could correspond to the use of expensive raw materials in a very simple value chain, while conversely a high share of the value could be added in the final stage of the production process.
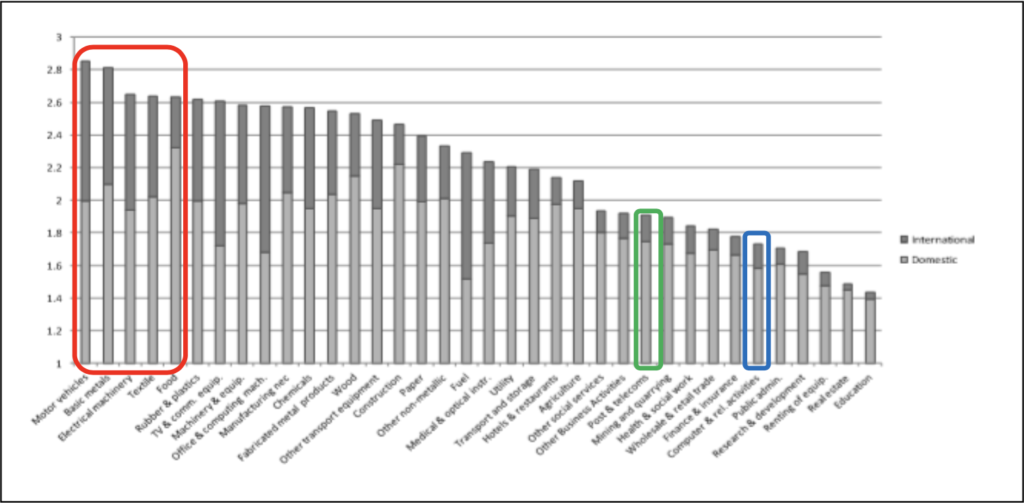
The five industries with the highest index of fragmentation are:
- Motor Vehicles
- Basic Metals
- Electrical Machinery
- Textile
- Food
Food industry is less internationalised than the four others although it has been moving higher over the last 15-years as tastes and diet demands have altered.
Service industries have on average shorter value chains as the principle activity takes place in the home location. Examples that illustrate this point are financial services on Wall Street and the City of London. That said, the migration of settlement operations to other locations such as India (good English language skills), means one again can see the service value chain advancing over time.
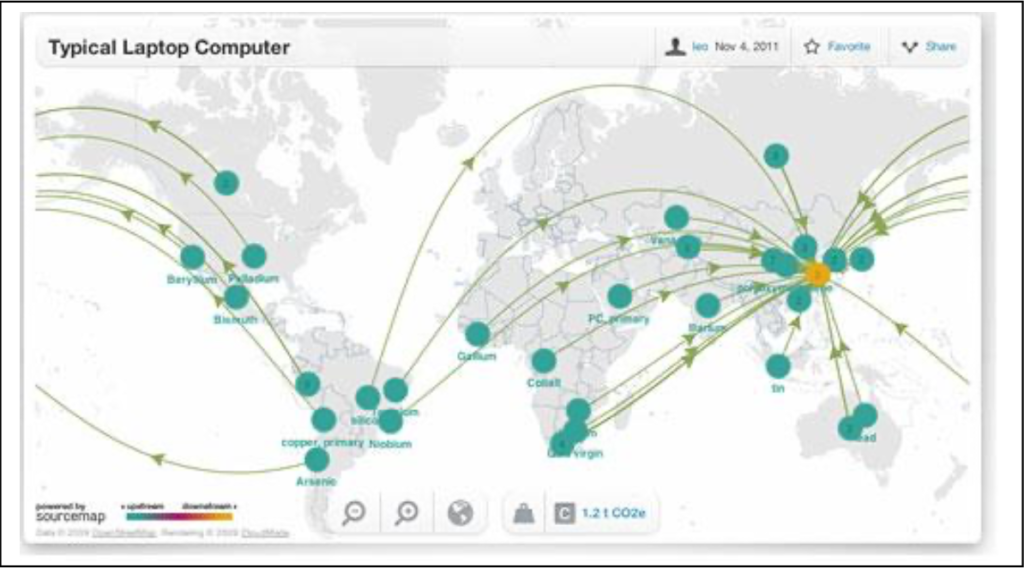
Interestingly, the rapid spread of mobile communication and the use of parts for assembly that are across many parts of the world means that of the sectors within services telecommunication and computing are among the activities where the length is the highest in the services sector. This has been driven by the importance of imported intermediate components. Look at the GSC for a laptop computer in Figure 4.
The drive to use GSC/GVC as a means of controlling costs has resulted in longer lead times with ever greater levels of in-transit and multi-channel inventories. This has in turn fostered ever more demands on the management of downstream and upstream logistics.
Even in the midst of lost domestic industries, steel and textiles in the U.S. and Western Europe and unemployment hotspots such was the rise in efficiency of GSC/GVC that 1% investment in international supply chain efficiency would deliver a far greater return on capital than an equivalent investment in the domestic supply chain.
Stopped In Its Tracks By Coronavirus
As Coronavirus spread from being a Chinese issue to a pandemic so lead times from input manufacturers increased dramatically.
According to a survey of 559 primarily U.S.-based companies conducted by the Institute for Supply Management (ISM) released on Tuesday, April 14 the lead time increases were up by:
- 222% in China
- 201% in Europe between March 17 and 30,
- and 200% in the U.S
In the third week of April there are some factories in Asia that have come back to production, however, ISM found they were only operating at 53% capacity on average. This meant that there were transit bottlenecks exacerbating delays. U.S. manufacturing is operating at just 72.7% capacity, down from 79.3% in 2018. Manufacturers’ and trade inventories in the U.S. fell 0.4% from a month earlier in February of 2020, following an upwardly revised 0.3% drop in January and matching market expectations. Inventories declined for motor vehicle parts -0.8%, wholesalers -0.7%; manufacturers -0.4% and retailers -0.3%. The ISM Manufacturing PMI for the U.S. declined to 49.1 in March of 2020 from 50.1 in February. This was better than the consensus forecast of 45. However, one cannot ignore the fact that the reading pointed to a contraction in the manufacturing sector as the coronavirus pandemic impacted all aspects of factory activity. Declines were seen in new orders 42.2 from 49.8, production 47.7 from 50.3, employment 43.8 from 46.9, inventories 46.9 from 46.5 and new export orders 46.6 from 51.2. Prices fell faster than expected as they declined by 18.5% and supplier deliveries slowed; up to 65 days from 57.3 days i.e. +14.5%. More worrying Also, comments from the ISM panel were negative regarding the near-term outlook, with sentiment clearly impacted by the coronavirus pandemic and energy market volatility. A rather disturbing 69% of survey respondents expect U.S. lead times to lengthen in the coming weeks.
This is reflected globally as in the Eurozone where the business climate indicator in the Euro Area dropped 0.22 points from the previous month to -0.28 in March 2020, the lowest since December and below market expectations of -0.05.
In the U.K., the Confederation of British Industry (CBI) reported in its quarterly gauge of manufacturing optimism in the UK tumbled to -87 in Q2 2020 from +23 in Q1. That was its lowest level since records began in the 1950s, as manufacturers took a sharp hit during the shutdown in response to the coronavirus.
U.K. firms in the industry sector expect output and orders to fall at a much faster pace, while employment is seen contracting the most since 1980. Investment spending plans for the next year sank to a survey-record low for buildings and plant & machinery, with record proportions of firms particularly concerned about demand uncertainty and internal finance availability.
Japan tells the same story as the Bank of Japan’s Tankan index for big manufacturers’ sentiment fell to a seven-year low of -8 in Q1 2020 from 0 in Q4 2019. The sentiment deteriorated particularly among firms in shipbuilding -29 from -7 in Q4, non-ferrous metals (26 vs -15, and petroleum & coal products -18 vs -12. Major firms plan to raise their capital spending by just 1.8%, down from 6.8% in Q4 2019and among non-manufacturing large firms, sentiment eased sharply to 8 from 20 in Q4.
Manufacturing Malaise
At the start of the year there were concerns over how the global economy would perform. Those worries seem like a fond and distant memory as so much of the gloom is down to the contagion of the GSC/GVC caused by coronavirus. This pandemic has hit all the major manufacturing bases simultaneously so driving a deep, global recession.
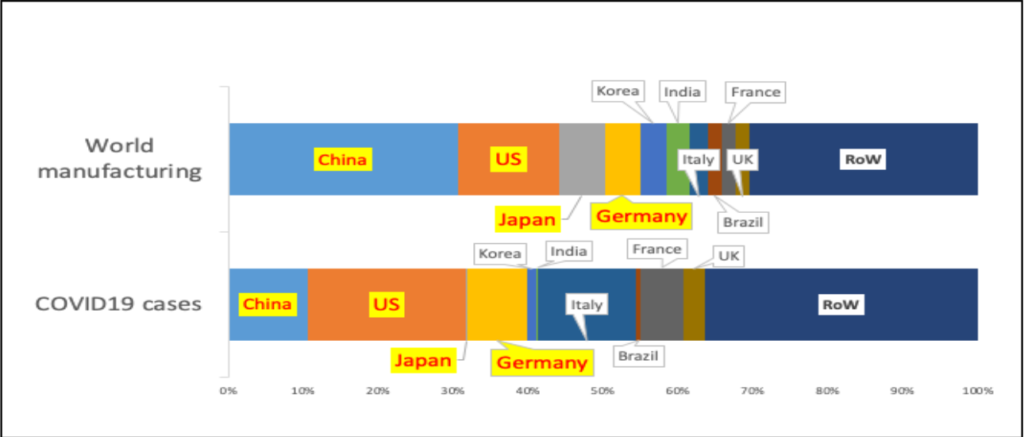
Manufactured goods are susceptible to sudden stop demand shocks. This has been exaggerated as for as the length of the GSC/GVC has increased so the simultaneous hit to all manufacturing hubs has brought a reconsideration of the reliance on lengthy chains to the forefront.
Of course, we recognise that there has been a huge decline in final private demand and so there is a disincentive to produce too many goods that consumers are not buying.
However, there is a growing call for the need to reinstate the local supply or value chain. A better control of certain imports is certainly growing in appeal. Without local alternatives, global industry is vulnerable…it is left exposed. Exposure is seen as being an unacceptable economic cost.
As a result, we believe that over the next decade there will be steps taken to provide a buffer against the vulnerabilities of the GSC/GVC network. When it comes to supply chain reliability, an idea that is gaining traction is to shorten the supply chain and keep things closer to home. From global to local.
Resilience needs to be permanently architected into the supply network. The ISM found companies that diversified sourcing during the U.S. – China trade war were better positioned to weather the coronavirus outbreak.
Global industry must take note. That means firms must seek diversification of sourcing and investment in operational efficiency measures to insulate themselves from future risks. This will not just mean every firm running its own, isolated chain. There will be a greater need, more than at any time in the past to create a climate of collaborative practices that firms develop with key customers and suppliers.
This can help ameliorate external impacts on lead time performance by adopting a value stream map of the supply chain to understand the drivers of lead time and to design a future state map to reduce the lead time.
If we have learned one thing from the pandemic of coronavirus it is long supply lead times created by having a GSC is something we must change if vulnerabilities are to be reduced.
We do not think the world will completely reject globalisation; however, it will backtrack and embrace the idea that shorter chains can deliver greater economic security and shorter lead times. In turn, it means that firms will need smaller inventory pipelines, have less risk of shortage, enjoy reduced quality risk and diminished risk of obsolescence.
Once we are through this crisis, the world economy will recover, but it will not be so keen to cuddle up to China as the hub of global supply it once was. It will not be business as normal. The world cannot afford that risk.
