Double Tops
Double Tops and Double Bottoms are identifiable as price patterns and are a common form of reversal. Once the pattern has completed following a breach of the neckline, they come with measurable implied targets for the subsequent price move.
- Double top pattern – The price starts to reverse lower following a sustained upside move. This leaves a key high. The initial move lower subsequently rallies again. However, the price finds resistance around the first high to form a second peak that is of similar magnitude to the first. The bull failure turns the price decisively lower to then break below the first reaction low, also known as the pattern neckline. This completes the Double Top reversal pattern and comes with a characteristic “M” shape.
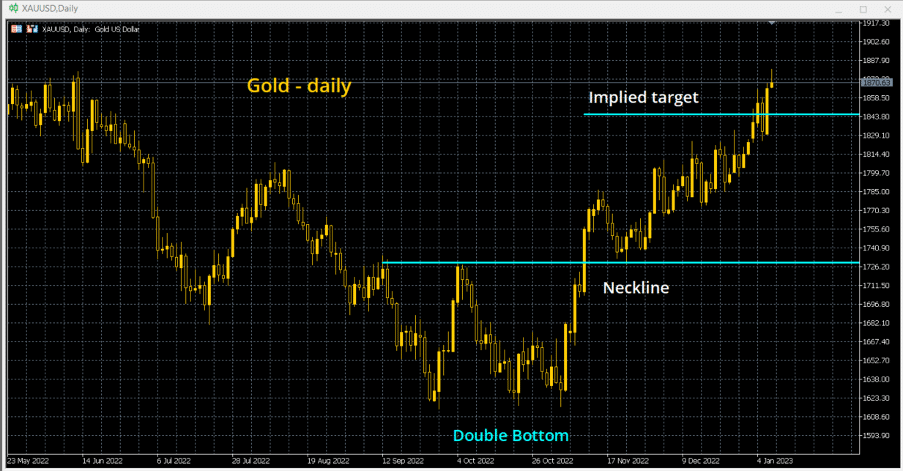
- Double bottom pattern – After a sustained downside move, the price starts to recover. This leaves a key low in place. The initial rebound falters and subsequently falls back again. However, the price finds support around the previous low before rebounding again. The price then recovers through the resistance of the first recovery high, or pattern neckline. This completes the Double Bottom base pattern and comes with a characteristic “W” shape.
Pattern completion and confirmation
As ever with technical analysis, it is important to wait for a reversal pattern to be completed before taking any trading signals. The neckline is a crucial aspect of the reversal pattern.
For a Double Top, the neckline is a crucial support that if broken signals a decisive end to the prevailing move higher and the likely formation of a new reversal lower. An intraday break of a neckline can complete a pattern, but for confirmation, we look for a close below the neckline support (or even a two-day closing break to be decisively sure)
On a Double Bottom, the neckline is a crucial resistance that if broken signals a decisive end to the prevailing move lower and the likely formation of a new recovery phase. An intraday break of a neckline resistance completes the pattern, but for confirmation, we look for a close above the neckline support (or even a two-day close above for added conviction.)
Measurable implied targets and pattern aborting levels
On the completion of a Double Top or Double Bottom, we can measure implied targets. There are also defined levels where the patterns abort. There are also subsequently definable levels for stop-losses, although these can be debatable.
Implied projections:
- Double Top – the magnitude of the top measured lower from the neckline support.
- Double Bottom – the magnitude of the base measured higher from the neckline resistance
Aborting the patterns:
- Double Top – some analysts take a move above the neckline resistance as the pattern aborting. We prefer to trade markets on a realistic basis and believe that prices rarely hold levels to the tick. We prefer to go by the rule of 2 to 1. Therefore, if there is a rally that reclaims more than half of the magnitude of the pattern, this is the pattern aborting. We prefer to place stop-losses above the mid-point of the pattern. (we would still though be on the lookout for a Triple Top pattern instead)
- Double Bottom – once more, some analysts would say a pullback below the neckline support would abort the pattern. We prefer to say a move below the mid-point of the pattern is the aborting point and would place stop-losses below there.
Variations
Technical Analysis is an art, not a science. It is very rare that you will find a perfect pattern that fits the textbook definition of a Double Top or a Double Bottom.
Variations include:
- The heights of the peaks on a Double Top are different, or the troughs on the Double Bottom are different.
- The second peak on a Double Top (or trough on a Double Bottom) is significantly longer or shorter than the first.
We tend to say, if it does not hit you between the eyes, then it is not a pattern. If you are having to justify it (or squint your eyes to see it) then it is probably not a viable pattern.
