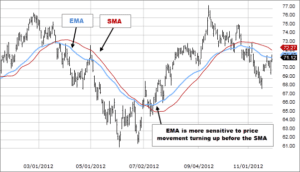
Daily Digest:
1 December: Global bonds and USTs backed up to higher yields Thursday, as US stock index futures were mixed, despite US PCE data showing inflationary pressures cooling. Friday's focus is on US and global PMI data, plus Powell speaks as the Fed go into its blackout period

Technical Analysis

  • Technical analysis is a method for projecting the future direction of the price of financial market assets. Furthermore, it can also be used in the setting of potential price targets. Also read our Expert forex market forecasts
  • The direction of future prices are determined by analysing previous market data; primarily price, time and volume.
  • Technical analysis predictions are rejected by proponents of Efficient Market Hypothesis and Random Walk Theory, which predicts that future prices are effectively unpredictable.
  • Technical analysis uses many different tools, methods and techniques, but primarily it employs price charts plotted over time to identify price patterns and trends.
  • For this reason, Technical Analysts are also referred to as Chartists.

In this section we provide articles to help develop the reader’s technical analysis knowledge base and to highlight ways in which technical analysis tools can be used for successful trading decisions. Read more articles on forex education.


Beginner

What is trading range and how does it work?

As a trader, one of the key concepts you must be aware of is trading ranges. You must be able to understand them and use as part of your technical analysis. This article will give an in depth review on trading ranges with examples making sure you understand them. What is trading range? Let us … Continued

Beginner

What Are Trading Channels?

Trading channels are primarily drawn as parallel support and resistance trend lines on the price chart for any financial market that you may be trading. They are indicators that help you to identify strong support and resistance levels and to also define the market’s trend. In addition, they can be used to signal a change … Continued

Beginner

What Are Trading Indicators? Part 2

Trading indicators are mathematical calculations (or algorithms) usually based on three inputs; price, volume and time, as we introduced in more depth in part 1. This article will build on the prior lesson, so you should make sure you have checked out part 1 first. How Many Types Of Trading Indicator are there? There are … Continued

Beginner

What Are Trading Indicators?

Trading indicators are an important area in technical analysis and are used in conjunction with the actual price action. Technical trading indicators are mathematical calculations or algorithms broadly based on three inputs; price, volume and time. They are visual representations that you can use to help in deciding the future direction of price, alongside other … Continued

Beginner

What Are Trend Lines and Breakouts In Trading?

Trend lines and breakouts are an important part of any technical analysis trading strategy. Trend lines will help you figure out whether markets are in a trending stage or a consolidation phase. You’ll find them very useful when defining uptrends, downtrends, ranges and breakouts. Being able to draw trend lines and identifying real breakouts are … Continued

Beginner

What are Candlesticks in Trading?

Candlestick patterns in trading are a way of looking at price action in a different way to the line, bar or OHLC charts we looked at in our article on types of charts. Candlestick patterns have a long and ancient history dating back to 18th Century Japan.  They were developed by Munehisa Homma, who was … Continued

Beginner

Best Technical Analysis Tools for Traders

In the world of trading every decision you make can be vital and impact your future financial situation, whether good or bad. It can be extremely exciting, but just as frustrating. It is essential for traders to use the right tools to maximise their chance of success, this will be explored as we continue.  All … Continued

Beginner

Rally Explained

What is a rally? A rally is a general term used in financial markets for a sustained price rise. Classically, a rally would have been seen as a rebound in price following a previous move lower. However, the term is used far more broadly now to cover a broad price rise. A rally can last … Continued

Beginner

Understanding Candlestick Patterns

Candlestick patterns are an exciting tool that traders can use when trading to diversify their trading experience and potential secure profits. This article will explore the world of candlesticks from the very basics of what they are to how best to trade them. They are a way to read the market from a different lens … Continued

Beginner

What are Chart Patterns? – Part 2

Charts patterns are formed on differing markets and asset classes when trends take a pause and go into a consolidation stage. Chart patterns are a way for you to be able to decide if the price is going to continue in the same direction as the underlying trend after the consolidation phase has ended, OR … Continued

Beginner

Correlation Explained

Correlations arise as the movement in one asset price can be linked to another. A correlation between two assets can be positive, negative, or not correlated. What is a correlation? A correlation is a statistical relationship between two variables. In finance markets, a correlation refers to the link between two assets or trading instruments. How … Continued

Beginner

Correction Explained

A correction in the price of an asset is an unwinding move after a prevailing run higher. The strict definition of a correction is a price move that has unwound between 10% and 20% following a significant high. When the price falls more than -20% the move changes from being a “correction” to being a … Continued

Beginner

What are Chart Patterns? Part 1

Moving on from our previous article on trading charts, the study of chart patterns is an area of technical analysis that deals with the patterns formed by the price movements on the charts. It is possible to identify these patterns on many different timeframes, from one-minute charts, through one-hour charts, to daily, weekly, and even … Continued

Beginner

What is Support and Resistance In Trading?

Two of the main concepts in trading and technical analysis are support and resistance. In basic terms, support and resistance are a specific price levels or areas of price that acts as barriers to a market price moving through them. It is a simple concept but identifying these levels can trip you up sometimes. Here … Continued

Beginner

What are Trading Charts?

Trading charts can be used to plot the price of any market; forex, stocks, bonds, commodities and more, any market where the price changes. Charts are at the core of technical analysis. For you, the trader, an understanding of different chart types is vital when using technical analysis and helps you make informed trading decisions … Continued

Beginner

What is Technical Analysis?

Technical analysis is a way of assessing financial markets to be able to determine and hopefully predict future market price moves. It is also sometimes referred to as charting, with technical analysts being known as chartists. Technical analysis is just one type of the many different approaches to market analysis that a trader, investor or … Continued

Beginner

Bulls, Bullish and Bull Markets Explained

In the purest sense, a positive person can be referred to as a “bull” and, as such, they can be “bullish”. The term is most commonly associated with trading in financial markets. A bull is a market participant that has a positive outlook and believes prices will be moving higher. The term “bull” is also … Continued

Beginner

Bears, Bearish and Bear Markets Explained

Any negative person can be referred to as being a “bear” and, as such, they can be described as “bearish”. The term is most commonly associated with trading in financial markets.   In the world of finance, a bear is a market participant that is negative about the direction of markets. They subsequently believe that … Continued

Beginner

Basis Points Explained

“Basis Points” (often shortened to “bps”) are a term used by financial market participants and institutions to express the change in value or interest rate of financial instruments. They are used to standardise changes in the value of financial instruments that are priced in percentages. Instruments such as interest rates or bond yields move in … Continued

Beginner

Spinning Top Candlestick Explained

A Spinning Top is a candlestick that indicates indecision in the market. It can be a warning signal that a potential change in outlook is developing. It is a small-bodied candlestick with long upper and lower shadows. The position of the candlestick “body” around the mid-point of the daily range suggests neither the buyers nor … Continued

Beginner

Shooting Stars and Hanging Man Explained

The Shooting Star is a popular bearish candlestick pattern that can be a powerful trend reversal signal. It is considered to be the polar opposite candlestick of a bullish Hammer. It generates the highest conviction when it is posted at the end of a decisive uptrend phase. It signifies exhaustion in the buying pressure before … Continued

Beginner

Doji Candlesticks Explained

A Doji candle can be an important signal in candlestick analysis. Where the OPEN price is equal to the CLOSE price, a doji candlestick has formed. Classically, a doji candle denotes uncertainty in the prevailing trend and is arguably a neutral signal. However, it would be wise not to dismiss them as trading signals. They … Continued

Beginner

Bullish Engulfing Explained

The Bullish Engulfing is one of the most powerful reversal signals. It indicates the exhaustion of a downtrend phase and the beginning of a new positive trend. The candlestick reversal starts with the market OPEN below the previous CLOSE (with a gap lower). The price then starts to move higher early in the session (the … Continued

Beginner

Bearish Engulfing Explained

A Bearish Engulfing candle is a bearish two-period reversal pattern. It can often be a very powerful reversal signal. The Bearish Engulfing can indicate exhaustion in buying pressure after a phase of positive price action. It is a candle that signals the beginning of a new trend of lower prices. The candle is most effective … Continued

Beginner

Piercing Line Candlestick Explained

A Piercing Line is a two candlestick pattern that is a bullish set-up that implies that the price has finished falling and is ready to start moving higher. It is best seen after a downtrend in the price. Candle 1 is a decisive bearish candle. It has a strong move lower from OPEN to CLOSE … Continued

Beginner

Morning Star Patterns Explained

A Morning Star is a three candlestick pattern that signals a key turning point in the market. It occurs when a decisive downtrend of selling pressure meets a point of exhaustion. This proves to be the key low of the trend. With the selling exhausted, the market then swings back higher for the start of … Continued

Beginner

Hammers & Inverted Hammers Explained

Hammers are some of the most popular and easily recognisable patterns in candlestick analysis. They can be a powerful and bullish reversal signal. The hammer is probably best defined as being a signal that comes at the end of a phase of selling pressure. After the open, the price falls to hit a new low, … Continued

Beginner

Evening Star Candlestick pattern Explained

An Evening Star is a three candlestick pattern that indicates a significant turning point in the market. It suggests that a prevailing uptrend has become exhausted and that a new trend of lower prices is coming. A bullish trend is being replaced by a new bear leg for the market. The perfect set-up has a … Continued

Beginner

Dark Cloud Cover Explained

A Dark Cloud Cover is a bearish two-candlestick pattern that implies the end of a bull phase and the beginning of a new phase of selling. It is best seen at the end of an uptrend in the price. Candle 1 is a decisive bullish candle. The price moves strong higher between the OPEN and … Continued

Beginner

Financial abbreviations explained

Abbreviations and acronyms are widespread in the world of finance. If you don’t know your FOMC from your ROCE, or your NFP from your GBP, we are on hand to give you a little help. There are lots to get through but by no means is our list exhaustive. However, hopefully, the ones that give … Continued

Beginner

Using Fibonacci in Your Trading

The Fibonacci sequence of numbers has been used in trading strategies for many decades now and is a valuable tool in the identification of important levels to monitor when trading markets. In this article, we will look at: The historical and mathematical basis of the Fibonacci numbers An outline of the various Fibonacci numbers used … Continued

Beginner

What are Time Frames?

Time frames can be a challenging aspect of trading to understand. Not just for beginners, but the idea of time frames even causes issues for more established and veteran traders. What we’ll cover Concept of trading time frames How they work Why understanding them is essential Different time frames and how they’re used We’ll be … Continued

Beginner

What are Trading Charts? — Part 2

In our article What are Trading Charts? — Part 1 we looked at how various trading charts work, why they’re important, how to read live charts and how to use them. Plus, we covered when charts should be used and what to consider when trading using charts.In this article, we explore the different types of … Continued

Beginner

What are Trading Charts? Part 1

Trading charts can be used to plot the price of any market; forex, stocks, bonds, commodities and more, any market where the price changes.Charts are at the core of technical analysis. For you, the trader, an understanding of different chart types is vital when using technical analysis and helps you make informed trading decisions Charts … Continued

Beginner

What is Technical Analysis?

Technical analysis is a way of assessing financial markets to be able to determine and hopefully predict future market price moves. It is also sometimes referred to as charting, with technical analysts being known as chartists. Technical analysis is just one type of the many different approaches to market analysis that a trader, investor or … Continued

Beginner

Misconceptions about technical analysis

Views about technical analysis vary widely across the investor and trader world, with some believing the analysis of charts and price patterns is a worthless endeavour, whilst others believe it critical to any investing or trading strategy. Many misconceptions and falsehoods have, therefore, been formed with respect to charting, as technical analysis is also known. … Continued

Beginner

Charts Patterns: Reversal Patterns

In this Master Academy educational video and article, we are looking at Charts Patterns, focusing on Reversal Patterns. Charts Patterns A chart pattern is a distinct formation on a chart that signals potential for future price movements Technical Analysts use these patterns to identify current trends, trend reversals and for buy and sell signals There … Continued

Beginner

Trend, Trendlines and Channels

In this Master Academy educational video and article, we are introducing the concept of Trend, Trendlines and Channels. What is Trend? Markets tend to move in a general direction or trend An Up Trend An up trend is a sequence of higher highs and higher lows In an up trend, price will rally to a … Continued

Beginner

Support and Resistance

In this Master Academy educational video and article, we are introducing at the basic concepts of Support and Resistance.Support and resistance represent key junctures where the forces of supply and demand meet. Support Support is the price level at which demand is thought to be strong enough to prevent the price from declining further A … Continued

Beginner

Introduction to Technical Analysis

In this Master Academy educational video and article, we are looking at an Introduction to Technical Analysis, elaborating on the brief introduction we had in our article Fundamental vs. Technical Analysis. In this article we will look at: What Technical Analysis is, the Principles of Technical Analysis Chart types Time Frames Principles of Technical Analysis … Continued

Beginner

Fundamental vs. Technical Analysis

In this Master Academy educational video and article, we are looking at the basics of the different approaches to analysing financial markets that come under the titles Fundamental Analysis and Technical Analysis. Fundamental Analysis There are FOUR subcategories that come under the banner of Fundamental Analysis: Macroeconomic Data Analysis Microeconomic Analysis and Corporate Data Central … Continued

Beginner

Technical Analysis – Glossary

Below we provide a glossary of key Technical Analysis terms. These range from the basic, through intermediate, to more advance terms used in the Technical Analysis approach to markets. Here we start with those terms beginning A through to P. You can click on a letter to find your section quicker. A – B – … Continued

Beginner

Technical Analysis – History

Technical Analysis has a long history and in Europe can be traced to the 17th century writings of Joseph de la Vega about the Dutch Stock markets. In 18th Century Japan, Homma Munehisa, a very successful rice futures trader developed the Candlestick trading approach, which is still used today. Charles Dow Jose De La Vega … Continued

Beginner

Technical Analysis – Principles

There are three basic tenets of technical analysis as follows: Market price action discounts everything. All information that is both relevant and available is already built into current prices. Price action moves in trends over various time frames. These trends are either down, up or sideways. History will tend to repeat itself. The common factor … Continued