Trading channels are primarily drawn as parallel support and resistance trend lines on the price chart for any financial market that you may be trading. They are indicators that help you to identify strong support and resistance levels and to also define the market’s trend. In addition, they can be used to signal a change in trend. A trading channel is also commonly known as a price channel.
What Is Channel Trading?
Channel trading is quite simply the use of channels in making trading decisions. What do we need to consider when using price channels when trading? Trading channels are a way for the technical trader to define important support and resistance levels that can help you to decide whether to buy and sell a particular market and at which levels to buy and sell, when entering and exiting trades.
How To Use Trading Channels
What do we need to consider when using trading channels? The most important factor to think above with price channels is whether they are indicating an up trend, a down trend or a sideways trend. This gives us the different types of channels, that we are going to look at below.
As well as defining the trend direction, once support and resistance levels have been identified from the channels, you should look to buy at or near to channel support and sell towards channel resistance. If, however, there is a breakout from the channel, this can often indicate a more impulsive, significant move in the direction of the channel breakout.
What Are The Different Channel Types?
The different channel types can be broadly split into two categories, the first of which can be then further subdivided into three types.:
- Trend Channels, which can be:
- Ascending Channels
- Descending Channels
- Horizontal Channels
- Envelope Channels
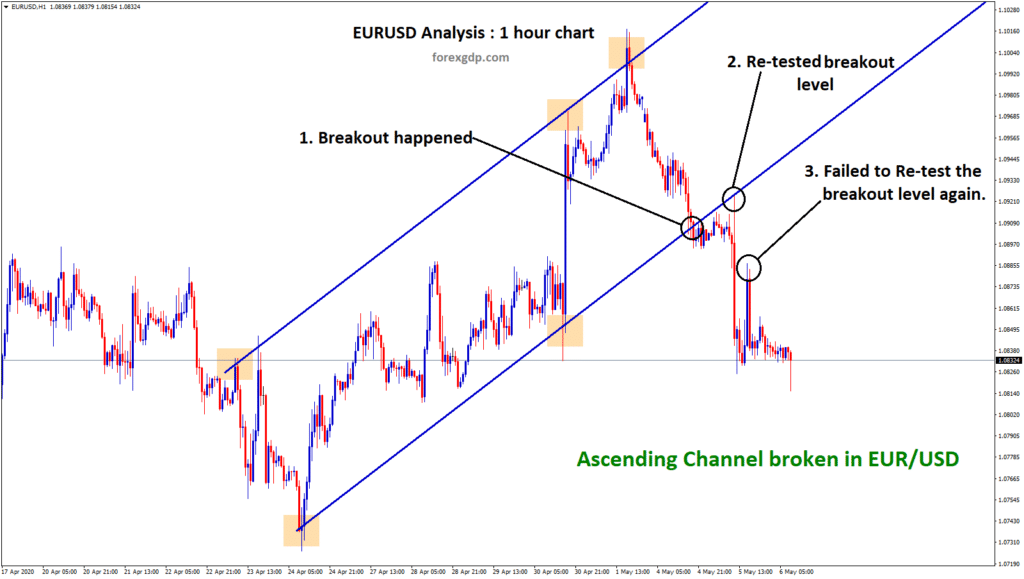
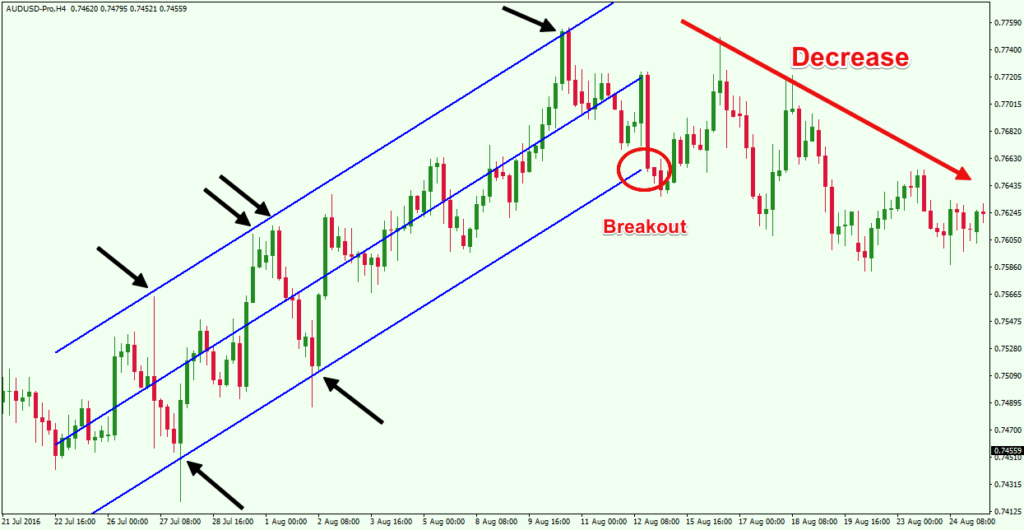
Ascending Channels
Ascending Channels are drawn by initially drawing an up trend line, by connecting important support lows. Then, a line parrel to this trend up trend line is drawn, connecting significant resistance highs, as in the image here.
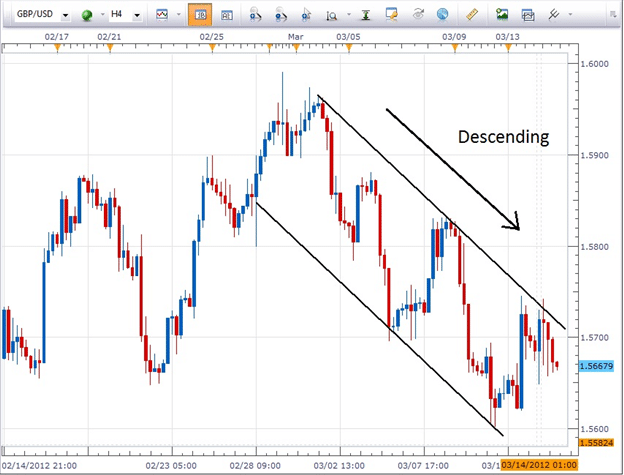
Descending Channels
Descending Channels are drawn by initially drawing a down trend line, by connecting important resistance highs. Then, a line parallel to this trend down trend line is drawn, connecting significant support lows, as in the below image.
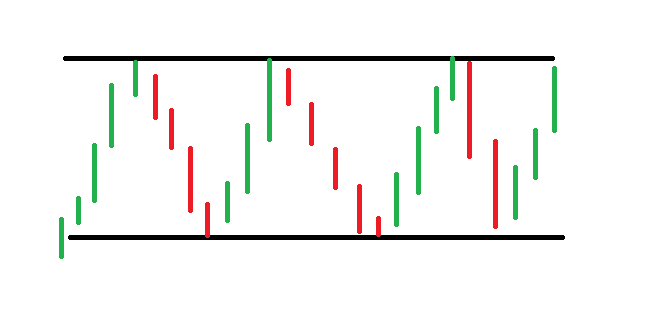
Horizontal Channels
Horizontal Channels are when there is no definable trend in the market, up or down. Parallel lines are drawn that define the sideways, range environment. See the image here.
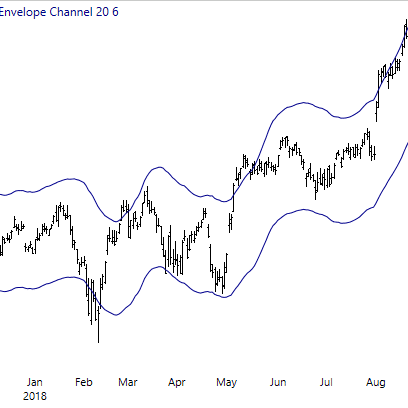
Envelope Channels
Envelope Channels are lines that are drawn based on statistical calculations. Rather than being straight, parallel lines, as in the above Ascending, Descending and Horizontal, these Envelope Channels can follow a more erratic path. We will look at the Envelope Channels in the next section on The Most Popular Trading Channel Indicators, but you can also see an example in this chart.
What Are The Most Popular Trading Channel Indicators?
The most popular trading channel indicators can be categorised as:
- Donchian Channels
- Bollinger Bands
- Keltner Channels
- Fibonacci Channels
- Stoller Average Range Channels (STARC)
- Linear Regression Channels
We will look at each of these in turn.
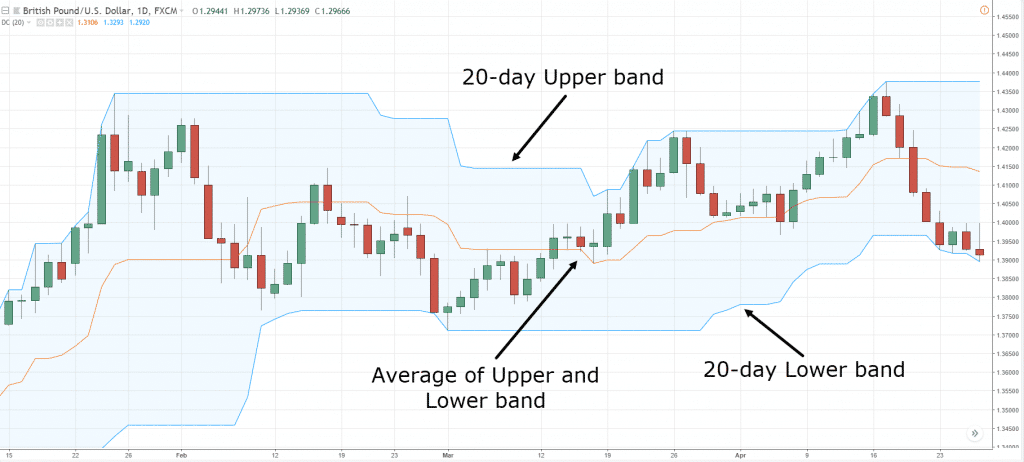
Donchian Channels
Donchian Channels were created by successful futures trader Richard Donchian in the middle of the 20th century as part of his trend following system, to assist in identifying trends. The calculations for Donchian Channels (that we show below) produce three lines on the price chart based on calculations of Moving Averages. The three lines produced are a mid-range line, an upper band (or channel) and lower band (or channel). Its primary use to you is providing buy and sell signals. The indicator identifies extremes of bullishness and bearishness, that can indicate reversals alongside breakouts.
Upper channel= Highest High in past n periods
Lower channel= Lowest Low in past n periods
Mid-Range line= (Upper channel- Lower channel)/2
Bollinger Bands
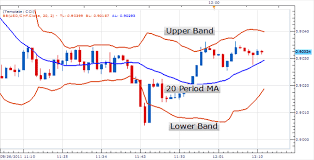
Bollinger Bands were developed by John Bollinger in the 1980s as a way of indicating when the market price of an asset was overstretched in one direction, either overbought, or oversold. Bollinger Bands are a set of price channels or envelopes around a simple moving average, plotted two standard deviations above and below the simple moving average. So, there are three lines, the simple moving average (usually a 20-period simple moving average) as the middle line or band, the upper and lower band.
Bollinger Bands were designed to show when a market has become stretched too far in either direction, which can help you with decisions on both market direction and buying or selling levels.
There is also the concept of the Bollinger Band “squeeze”, which is when the bands narrow in towards each other, highlighting a phase of low volatility. This usually indicates a likelihood of a breakout in the short-term, in either direction.
Keltner Channels
Keltner Channels were devised by Chester Keltner in the 1960s and are again a set of three lines, a mid-line and two envelopes or bands above and below the mid-line. The middle line is an exponential moving average (EMA), usually a 20 period EMA. The upper band is two times the Average True Range (ATR) above the EMA, with the lower band two times the Average True Range (ATR) below the EMA. The ATR is usually set at 10 periods. The upper and lower bands will widen and narrow with volatility, which is measured by the ATR.
When price fluctuates between the bands, they can be used as support and resistance. However, a forceful, impulsive breakout from the bands would signal a more bullish or bearish tone and could indicate trend continuation and extension in the direction of the breakout.
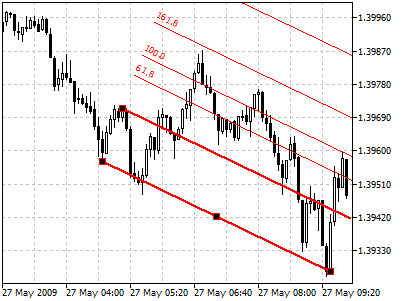
Fibonacci Channels
Fibonacci Channels are more similar to Ascending and Descending channels, in that initially an up or down trend line is drawn as we describe above, then a parrel line is drawn to create the channel. Then, we apply to the Fibonacci levels and percentages we use in trading, such as 23.6, 38.2, 50, 61.8, 78.6, 100, 138.2, 161.8, 200, 238.2, etc to the channel to create Fibonacci Channels. These Fibonacci Channel lines are effectively potential extension levels if the price breaks out from the initial Ascending and Descending channels. The Fibonacci Channels are support and resistance target levels above and below the channel. This is best seen on the chart here.
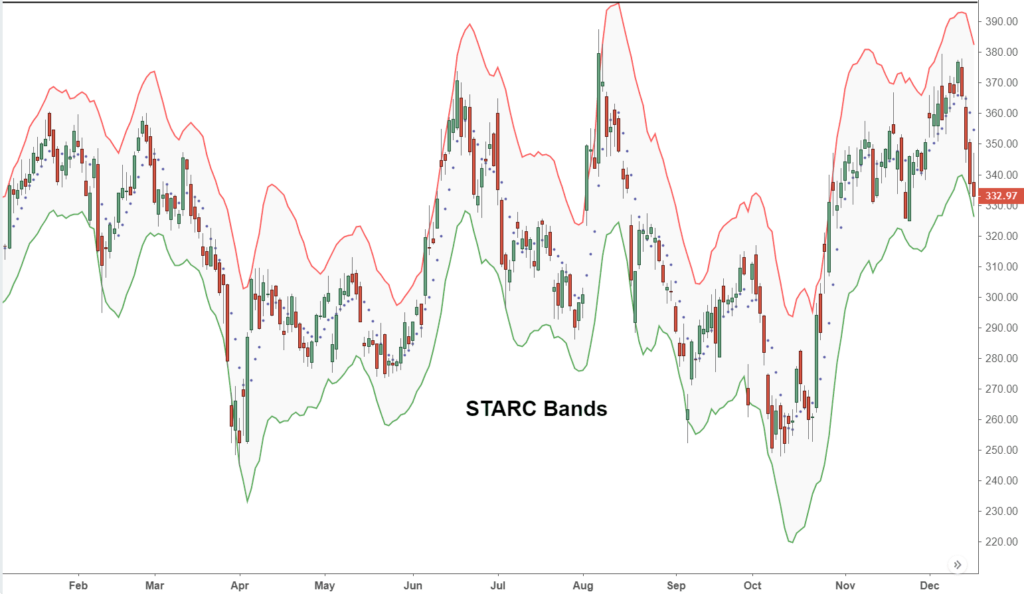
Stoller Average Range Channels (STARC)
Stoller Average Range Channels are better known by their acronym, STARC bands and were developed by Manning Stoller. They are similar to the Keltner Channels, in that there are a set of three lines, a middle line and two bands above and below this line. The middle line is a simple moving average (SMA), compared to the EMA with the Keltner Channels. The upper band is then a percentage/ multiplier of the Average True Range (ATR) above the SMA, with the lower band a percentage/ multiplier of the ATR below the SMA.
As with the Keltner Channels, the upper and lower bands will widen and narrow with volatility, which is measured by the ATR. The percentage/ multiplier of the ATR is for you to decide upon, although 200%, or two times is commonly used, which is the same as the Keltner Channels. The SMA is usually set between 5- and 10-periods.
Linear Regression Channels
Linear Regression Channels once more are made up of three lines, the Linear Regression line and again upper and lower channel lines. The Linear Regression line is a straight line that “best fits” the prices between a start price and an end price. A “best fit” means that a line is composed so there is the least amount of space between the price points and the Linear Regression Line.
The upper and lower channel lines would then be drawn parallel to the Linear Regression line, usually one or two standard deviation above or below the Linear Regression line.
The Linear Regression line can be seen as similar to a moving average and is viewed as the mid-point of the trend, the equilibrium price of the trend. When price moves away from the Linear Regression line, you would anticipate price to move back towards this line.
In an up trend, if price moves below the lower line and then moves back within the channel, this would be a possible buy signal, for a reversion back to the Linear Regression line.
In a down trend, if price moves above the upper line and then moves back within the channel, this would be a possible sell signal, for a reversion back to the Linear Regression line.
Trading Channels Summary
In this article we’ve looked at what trading channels are and the different types of channels. We’ve explored how to use channels in trading and the most popular trading channel indicators. This should now give you a platform to start to use channels in your financial markets trading. To continue learning check out our article on trading theories.
