In the last three weeks, there has been a decisive shift in the outlook for gold. A two-month corrective downtrend that drove a retreat in the price from $2072 to a low of $1892 (a near -9% correction) has now turned on its head. A rally has taken hold as two key intertwined factors have played out. Treasury yields have fallen and the USD has weakened. Both have been driven by a reassessment of how hawkish the Fed will be in the coming months. The continuation of this will help to fuel a gold rally.
- A reassessment of Fed tightening has been key
- Lower yields and USD weakness is key for gold
- Technical analysis shows gold testing a crucial resistance
A shift in the outlook for the Fed
The past few weeks have seen a decisive shift in how markets are viewing Fed tightening in the coming months. Previously, the views had been hawkish. A hawkish hold in the June FOMC was likely to be the prelude to two more rate hikes in 2023. The hawkish rhetoric of FOMC members (led by Fed Chair Powell) had been helping to mould these views too.
However, the Nonfarm Payrolls report at the beginning of July marked the start of a shift. Although there had been hints in the surprise jump in unemployment a month ago, jobs growth remained strong in May. However, in June, the first negative surprise in the headline jobs growth in well over a year put the cat amongst the pigeons. The strong rise in Treasury yields that had begun in late June went into sharp reverse. Subsequent negative surprises in the US CPI and PPI inflation data served to fuel the reversal. With signs of strain in the labour market and inflation showing signs of decisively falling, the view now is that perhaps the Fed might not need to hike as high or keep rates tight for as long.
This has re-shaped the outlook for the culmination of the Fed’s tightening cycle. According to CME Group FedWatch, one more hike is nailed on (99% probability) in July. That has not changed. However, beyond that, markets are struggling to price for anything more. Furthermore, the timing of when the Fed will begin to cut rates has been brought forward too. May 2024 is now confidently priced in, with March perhaps even possible. Notably, this is also in line with the six months historic average time between the final rate hike and the first rate cut.
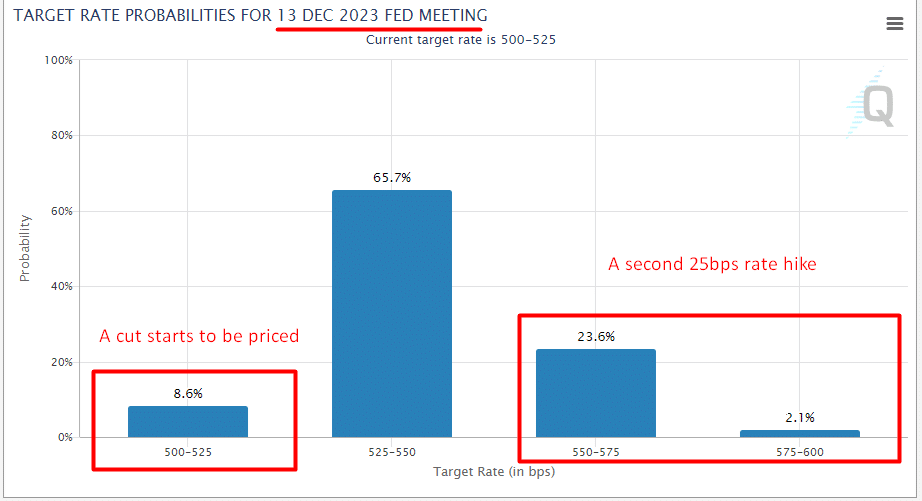
Furthermore, for the December meeting, the potential for a second rate hike has started to reduce (from around 30% in November), whilst also the potential for a rate cut starts to emerge.
Falling yields and USD weakness supports gold
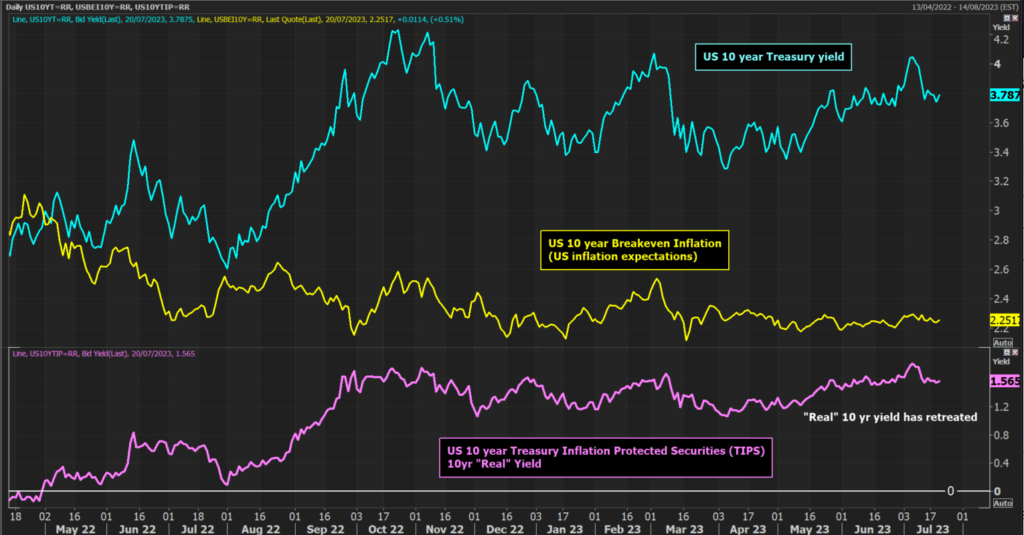
This shift means that Treasury yields have fallen decisively. The 10-year yield has fallen from 4.09% to the current 3.79%. However, with only a marginal reduction in inflation expectations (measured by the US 10-year Breakeven Inflation), the “real” yield on US bonds has fallen back.
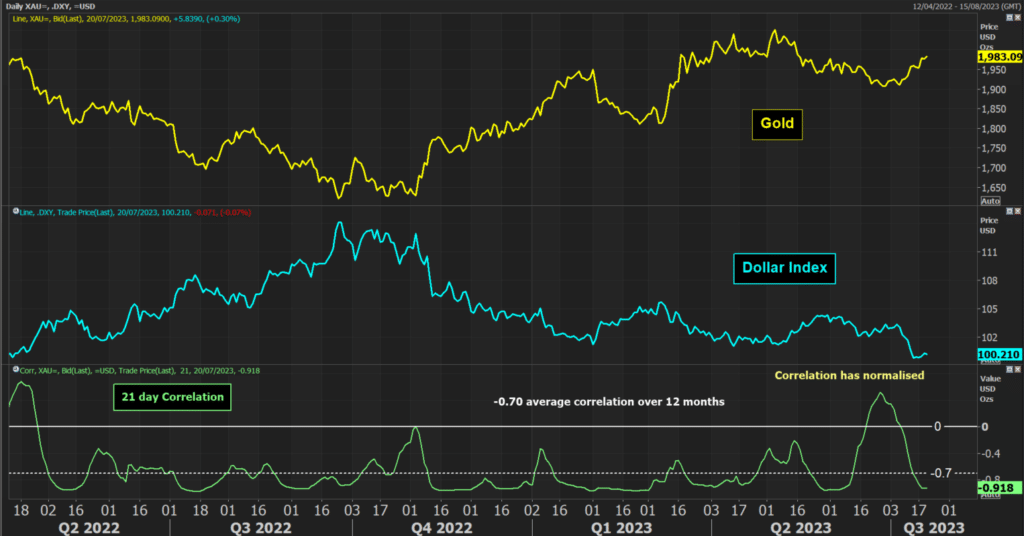
This is important for the outlook of the USD and by extension the outlook for gold. As yields have fallen, the USD has come under selling pressure. Despite becoming slightly decoupled from each other in late June, the direction of real yields and the USD is still historically strongly positively correlated.
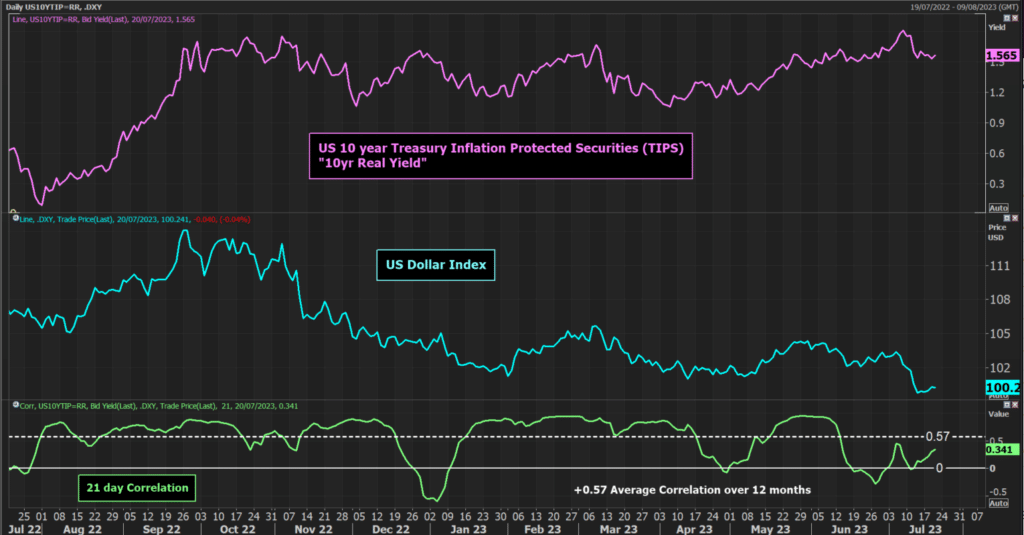
More importantly, the falling USD is positive for gold. There had been a consistently strong negative correlation between USD and gold for over a year until June. However, that correlation has normalised and is once more strongly negative. It means that the weaker USD is helping gold to rally.
Technicals show gold on the brink of another breakout
Looking at the technical analysis of Gold futures, there has been a decisive improvement in the past few weeks. The downtrend that had dominated since early May has been broken. Momentum has turned decisively positive with the daily RSI now consistently above 50 (having consistently been below 50 during the downtrend). The market is also now making higher lows, the mark of a developing bull trend. The higher low at $1946.60 is therefore key support now.
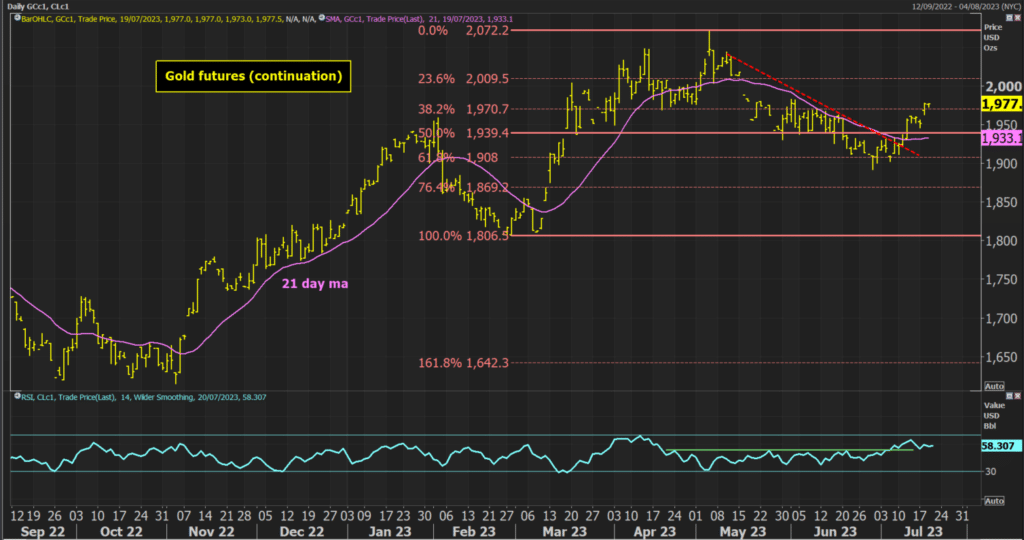
The rally has moved through resistance at $1970, and this now means that the lower high at $1983 is a crucial test. Not only is this price resistance, but it is also the 50% Fibonacci retracement of the May/June correction. Breaking through this confluence of resistance on a closing basis would be a strong signal for a continued recovery. It would open moves above $2000 once more and confirm that the correction has turned into a new bull run higher. It would also give me a preferred strategy of buying into weakness.
