Despite its performance, gold will always have a following amongst the investment community. The price has been falling for much of 2022. However, as the disclaimers warn us, prices can go up as well as down. Could this all be about to turn around again?
We look at the key factors driving the gold price. We consider macroeconomic drivers such as inflation, US bond yields, and the outlook for the US dollar (USD). We also use technical analysis to assess the outlook for gold as we see whether the price has reached a key turning point.
What are the significant drivers of gold?
Several factors drive the gold price. Most will contribute in some way to the outlook. However, some tend to be more significant than others. Here are a few factors to consider when assessing the outlook for gold:
- The outlook for real interest rates – Gold is a zero-yielding asset, so changes to central bank interest rates will impact the outlook for gold. Additionally, the outlook for inflation and deflation will also impact the outlook for gold.
- The outlook for the US dollar (USD) – Gold is priced in USD and subsequently, the strength of the USD has an impact on the price of gold. A stronger USD means will be negative for gold priced in USD to international buyers of gold.
- Gold as a “safe haven” – Gold is not only finite but it is in small supply. According to the World Gold Council (plus other sources), it is estimated that there are only around 244,000 tonnes of gold in the entire world (including mined and estimated below ground). As such it is seen as a safe haven asset that performs well during times of geopolitical and economic stress.
- The physical dynamics of gold supply and demand. The gold price will fluctuate with the outlook for supply (the rate that gold miners can extract gold). It also fluctuates with changes in demand from private sources such as for jewellery (around half of total gold demand) and investments (around a quarter of demand) such as for portfolios and Exchange Traded Funds, in addition to central banks (to diversify their assets).
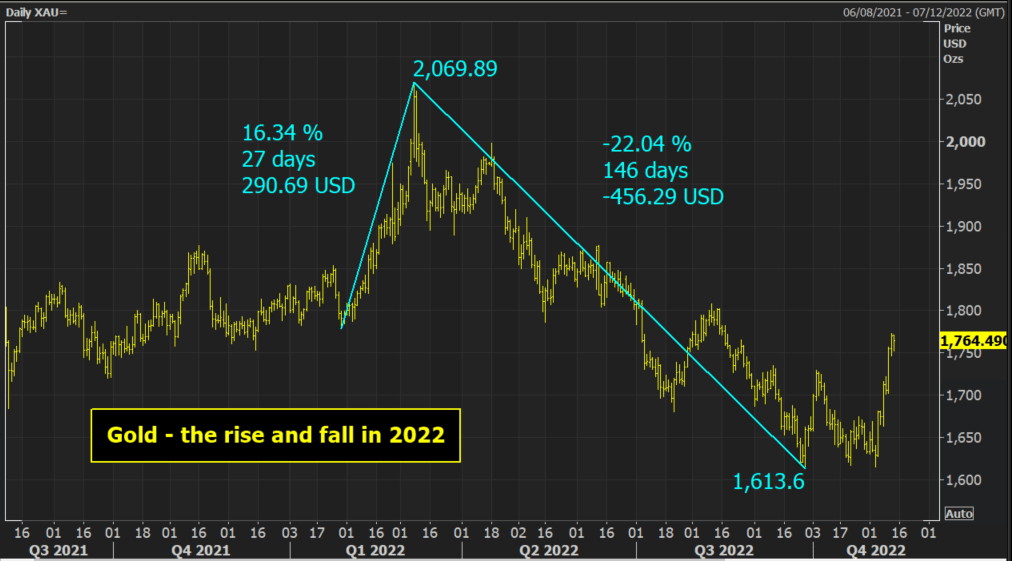
The rise and fall of gold in 2022
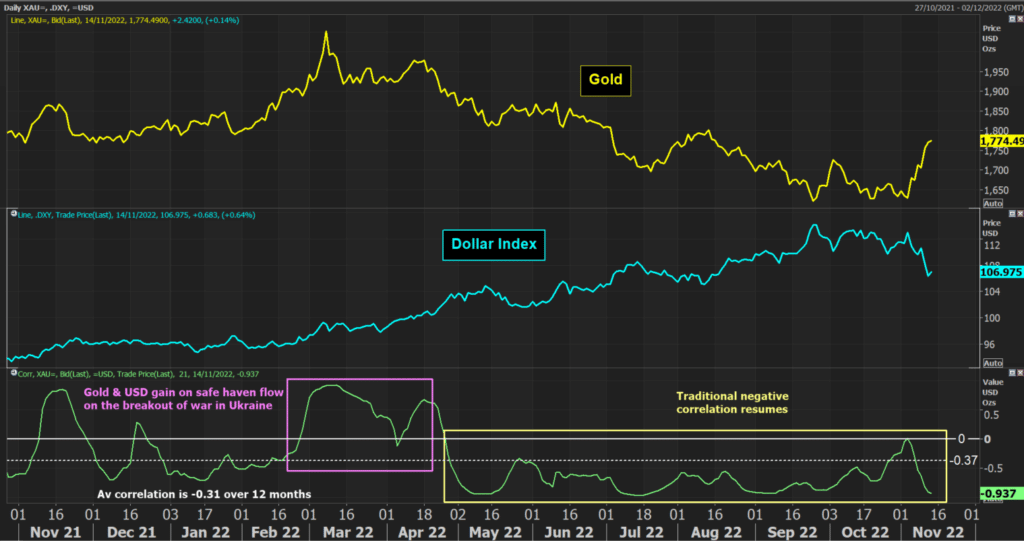
The early weeks of 2022 saw a significant run higher in the gold price. During February and into early March the price ran quickly higher on elevated geopolitical risk. Hitting a high of $2070 as global markets reacted with a massive flight to safety on the breakout of war in Ukraine. However, since March there has been a steady decline in the price. A move lower of -22% from the high shows that 2022 has been a bear market for gold. The primary drivers have been a combination of significantly higher US real bond yields and sustaining USD strength.
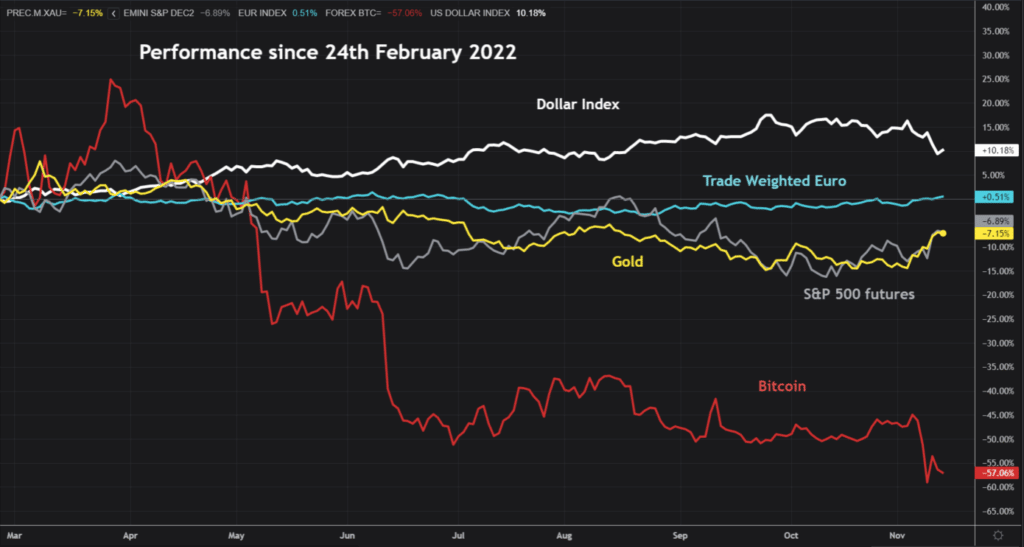
The relative performance of Gold Since the Ukraine War.
Although the gold price has been falling consistently throughout much of 2022, this does not mean it has been a bad investment. The performance of almost all major assets has been negative (aside from the USD) since 24th February (when Russia invaded Ukraine). However, a recent recovery has certainly helped to mitigate some of these losses.
Gold has not had an especially poor performance since 24th February. It has had a performance similar to Wall Street. Furthermore, the massive sell-off in Bitcoin dwarfs everything in its downside. The USD has been the standout performer. The Trade Weighted EUR (euro against a basket of currencies) has held up relatively well.
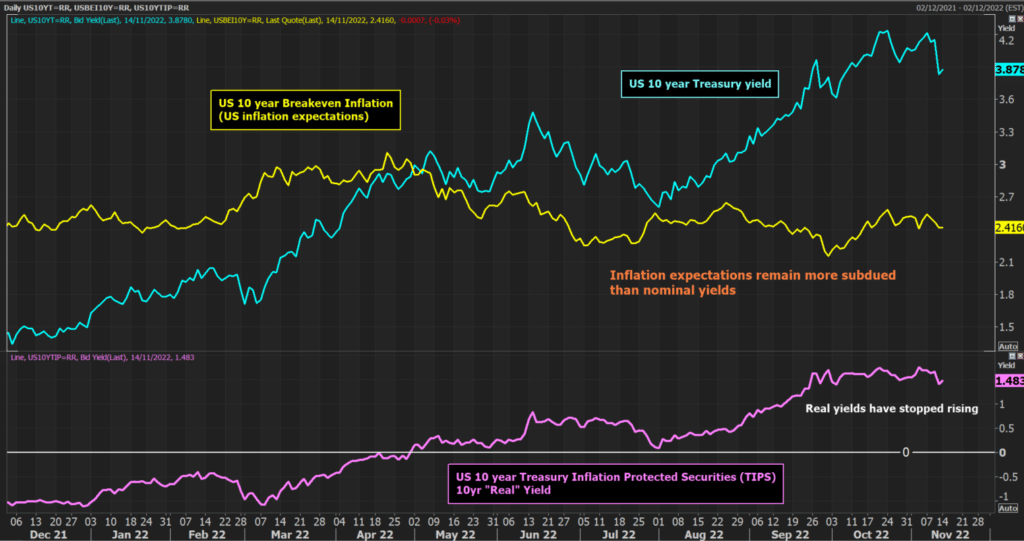
Negative correlations have weighed on Gold
The driving factors of a lower gold price have been its negative correlations with both rising “real” US bond yields (i.e. US bond yields minus inflation) and the strength of the USD. A significant rise in nominal US Treasury yields has been a key trend of much of 2022. The US 10-year yield has risen from around 1.70% in March to hit a high of 4.23% in October. High levels of inflation have been a key concern for investors throughout 2022. However, it may come as a bit of a surprise when we consider that US inflation expectations (as measured via the US 10-year Breakeven Inflation rate) have been trending lower since April. Coupled with the sharp rise in bond yields means that “real” bond yields have been pushing strongly higher since early March.
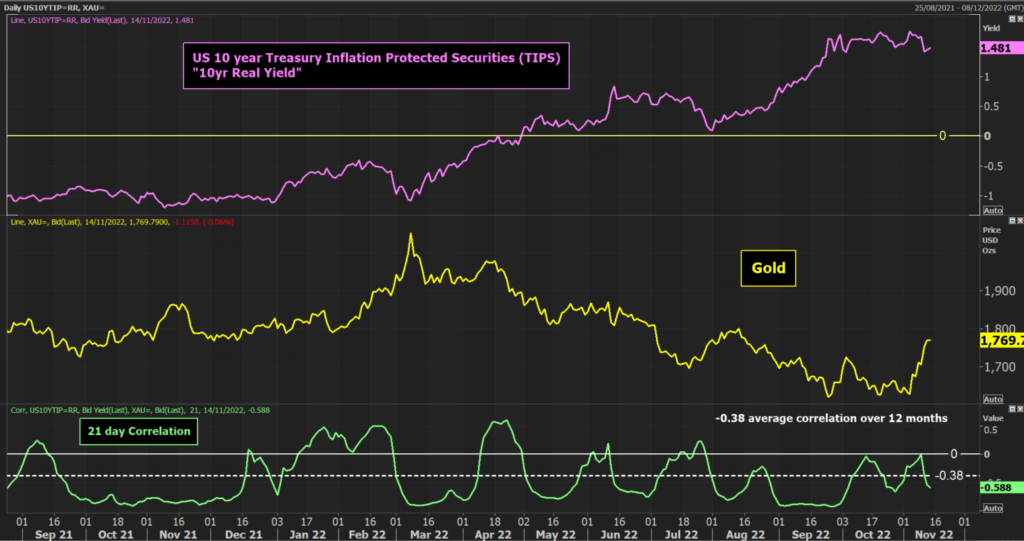
We said earlier that Gold has a negative correlation with real yields. This is shown by the timing of the peak of $2070 for gold in March coinciding with the key low in real yields and the strong divergence in the trends that have followed. Gold and the US 10-year “real” bond yield have averaged a correlation of -0.38 in the past twelve months. This is strongly negative.
We can also see a strong negative correlation with the USD too. There is an average correlation of the past 12 months of -0.37. Over the past seven months, the correlation has been consistently negative. Also looking at the two trends, they are almost a mirror image of each other.
What is needed to drive a recovery in gold
So looking at these charts, we can see fairly quickly what would be needed for gold to embark upon a significant rally. If there was a fall in real yields and a decline in the USD, then the conditions would be set fair for a rally in the gold price. So the big question is whether US bond yields and the USD are going to fall significantly.
US Treasury yields started falling in early November, but real yields have remained fairly steady. Signs of a peak in US inflation have weighed on nominal yields, but the Federal Reserve is still likely to continue to increase the Fed Funds rate well into 2023. To prevent bond markets from getting ahead of themselves, continued hawkish rhetoric is also likely into the end of 2022. This could create a ranging scenario for bond yields.
This ranging outlook could also begin to take hold of the USD too. The long bullish trend of 2022 may have broken, but this does not necessarily mean that the USD will begin to go on a big correction. If yields hold up (on both a nominal and real basis) then we can expect the USD to also build a trading range.
Has the gold price bottomed?
We believe that there is a strong reason to believe that gold has now left a decisive low and can begin to build higher once more. Looking at the fundamentals, there seems to have been a shift in the outlook for the drivers of gold. Real yields are starting to move sideways, whilst the long uptrend on the USD has been broken.
Although it may be still a little early in the formation of a decisive USD correction, and this could still prove to be a ranging phase. However, the arguments are mounting for a key high being in place now in the USD.
If so, this translates well for a bottom in the gold price. There was a low of $1614 in September which has yet to be broken.
What are the technicals saying?
The price has been showing improved technical analysis too. Looking at the charts, there are reasons to be hopeful of a recovery on gold:
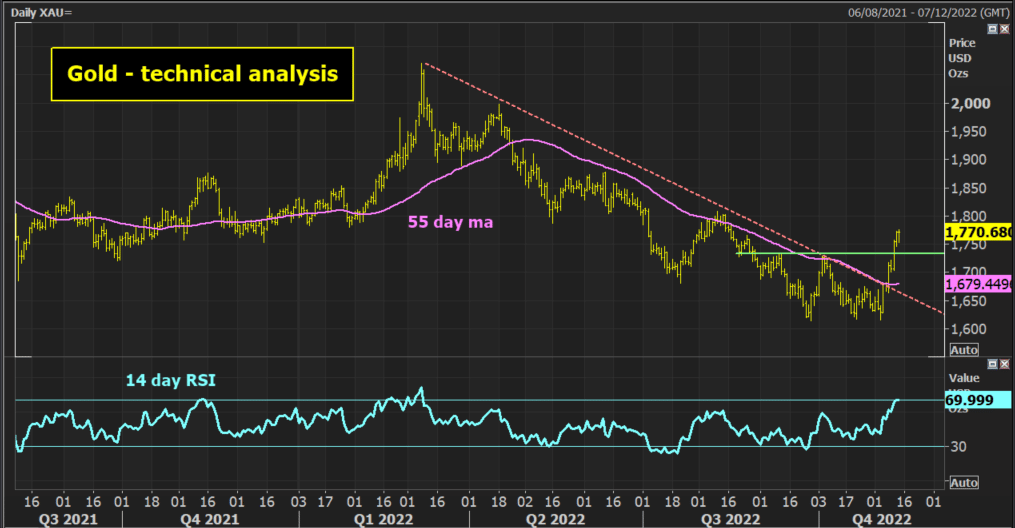
- The primary downtrend has been broken – A nine-month downtrend that has been very strong throughout the bear market has now been broken.
- A double bottom base pattern – The low at $1614 was revisited but not breached. The price has subsequently rallied to break above $1735 resistance to complete a double bottom. The implied target is $1855.
- Strengthening momentum – The Relative Strength Index momentum indicators recently moved to its strongest level since the March peak. The RSI pushing towards 70 is a reflection of the strength in the recovery. With the improved momentum, this suggests an end to the strategy of selling into strength during the downtrend. It also means a potential new strategy of buying into weakness could be coming. A reaction to an unwind in the price is key now. A bullish outlook would see an unwind on the RSI rebounding from 40/50.
- A move above the 55-day moving average – The 55-day ma has been an excellent gauge for gold throughout the downtrend. The moving average was broken recently and is now starting to turn higher. We would be looking for this to become a basis of support for any near-term corrections for gold.
Summary: Is it time to stock up on Gold?
So returning to the big question. Is it time to stock up on gold? From a macro perspective, there is a broken uptrend on the USD, whilst real bond yields have stalled. This suggests that the key drivers of gold are no longer weighing the price down.
We believe that a key low has been seen in the gold price. The technical analysis reflects a decisive shift away from the bearish outlook that has dominated for much of 2022. There is also a base pattern that implies a measured move to $1855. Near-term overstretched positions on the momentum may induce a near-term correction, but the signs are certainly promising for the gold price to engage a recovery in the weeks ahead.
