US CPI inflation was expected to fall in June, but not to the extent that it has. The negative surprise is significantly impacting major markets. As traders react to what they see as the implications of the decline in inflation, an already corrective move in the USD is threatening to move into an accelerating tailspin.
- A sharp downside surprise to US CPI
- Bond markets are reacting with a dive in Treasury yields
- This is weighing on the USD
US CPI falls sharply
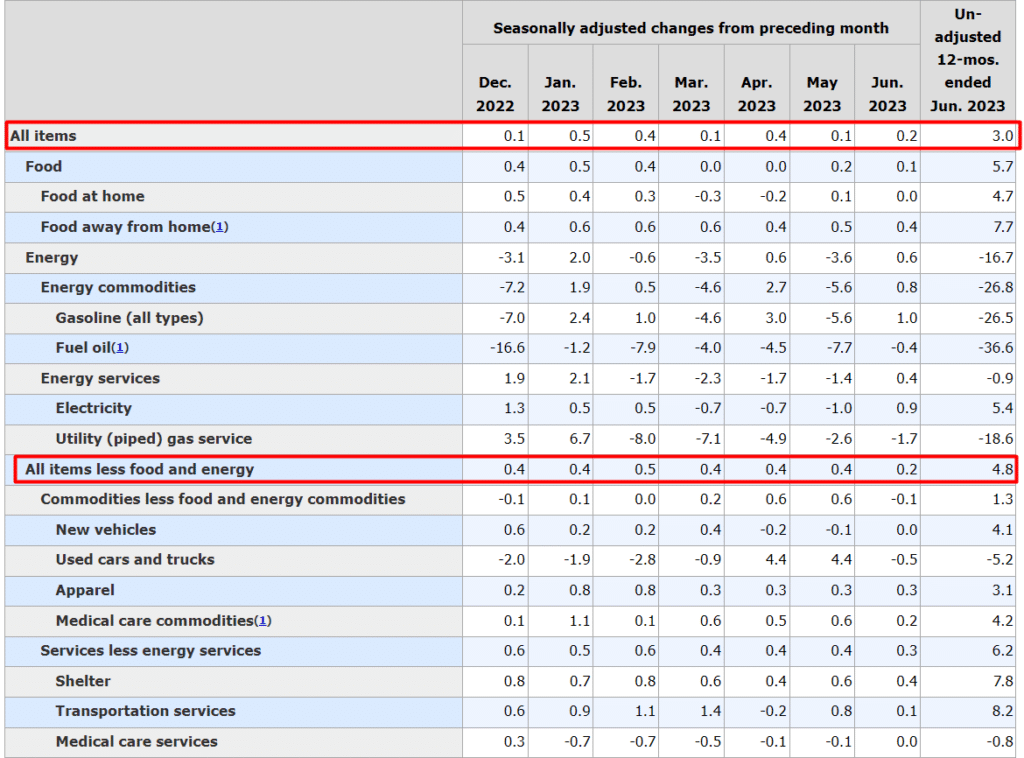
US CPI inflation has fallen sharply in June. The data for both headline (all items) and core (less food and energy) has not only fallen hard but also fallen much more than expected too.
- US CPI has fallen to +3.0% YoY (from +4.0% in May) which was lower than the +3.1% forecast.
- US Core CPI has fallen to +4.8% (from +5.3%), again lower than the +5.0% forecast.
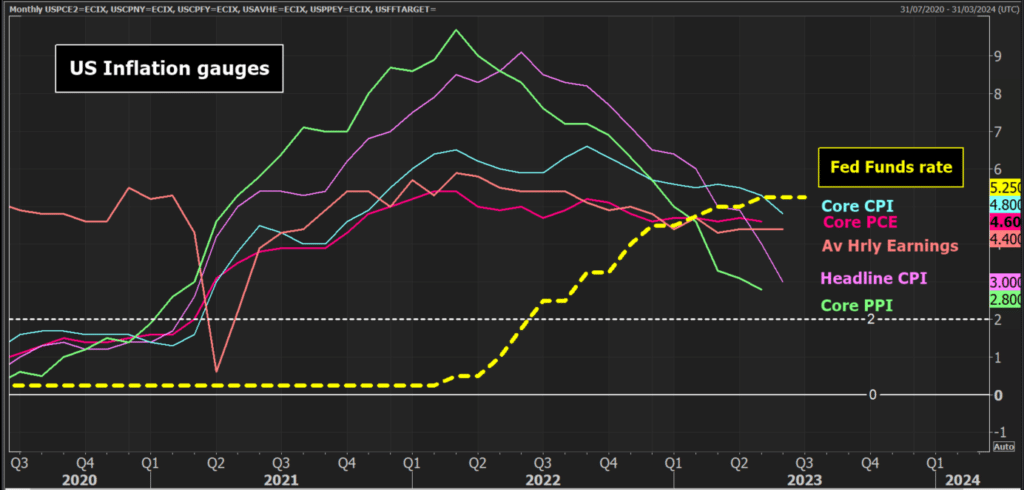
This now means that all US inflation measures are now below the level of the Fed Funds target range of 5.00% to 5.25%.
The monthly data is equally interesting. Monthly inflation increased by just +0.2% for the core and headline CPI. It means that for headline CPI, the past four months are on an average run rate of +0.2% (pretty much the Fed’s target), whilst the increase in monthly Core CPI has dropped well below levels of recent months. Both are positive signs for the Fed.
What does this mean?
Inflation continues to fall in the US. Fed members have been worried about stubbornly high inflation which has been the source of the hawkish comments that have come on several occasions in recent weeks.
However, this is the second month in a row where the CPI data has come in with a negative surprise. This may now induce some less dovish rhetoric out of the Fed over the coming days. The FOMC Blackout comes into force this weekend, so there will only be a few days to get any responses out. Markets will be keeping an ear to the ground for any dovish comments.
It is likely to be too late for any change to the pricing for a rate hike in July, however, this certainly brings into doubt any further hikes. Fed members have guided for two more hikes (in the June dot plots), but this is now doubtful. The timing of the first cut to interest rates could also be brought forward.
The Overnight Index Swaps which price US interest rate hikes suggest the peak rate has only been marginally reduced (so far) to 5.38% (from 5.42% earlier). This suggests only one more rate hike from 5.25% is probable at this stage.
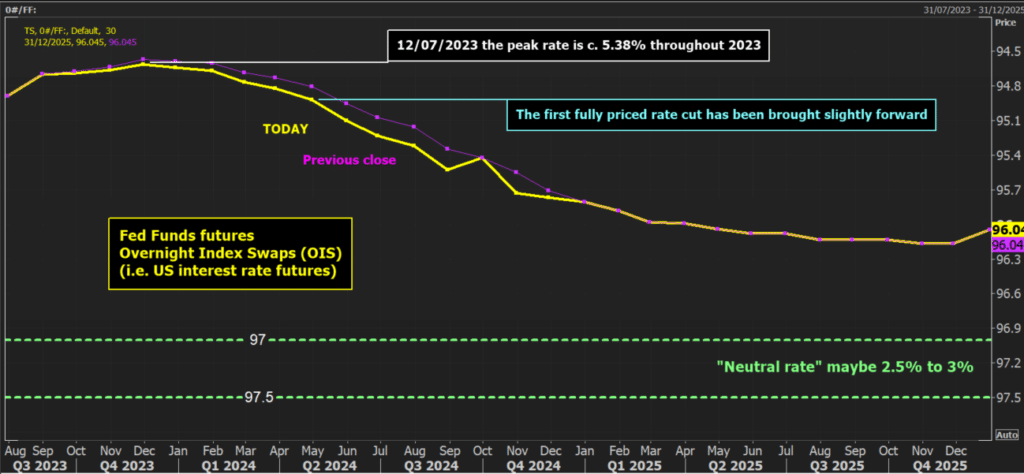
We have seen more action further out the OIS curve, with the pricing for the resumption of rate cuts coming in May next year (rather than June).
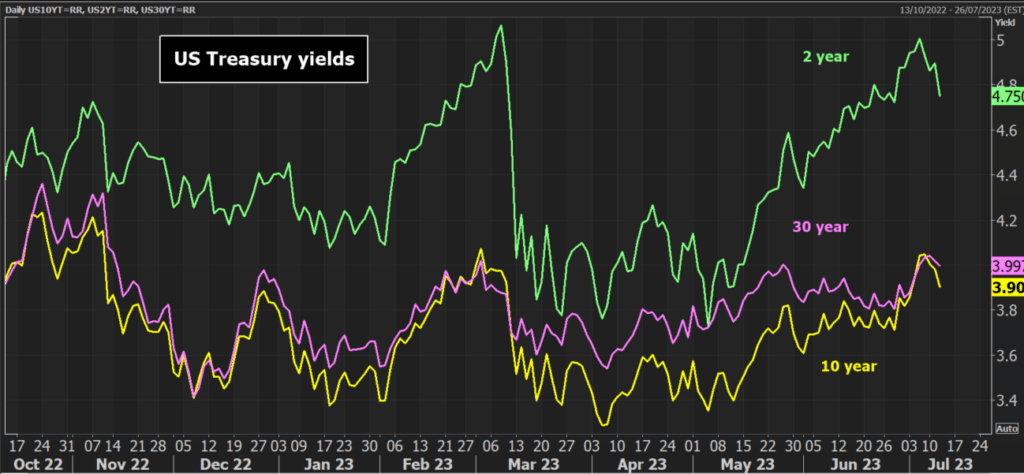
US Treasury yields fall sharply
With a tepid Nonfarm Payrolls report and now a downside surprise in the CPI, we have seen a huge unwinding of the move higher that was seen last week on Treasury yields. On Friday before the payrolls report the US 2-year yield was above 5.00%. It is now around -25bps lower at 4.75%, having fallen around -10bps since the CPI data. The US 10 year has also fallen decisively, from above 4.00% to 3.90%.
This is subsequently driving a sharp move higher in the yield spreads. Spreads are still deeply negative (the 2s/10s is at -85bps) but this is still much better than it was previously. Last week the spread was at -1.08%. This is helping to create a more risk-positive/USD-negative environment for trading. Almost anything that trades with a negative correlation with the USD is being bought (metals are up, and US index futures too).
The USD plunge continues
Since the Nonfarm Payrolls report last Friday, the USD has gone into sharp reverse. The chart of the Dollar Index shows that the USD is currently in a freefall back towards a crucial support level. The index has dropped from above 103.00 where it was before the payrolls, to now be set to test the support of the 100.78 key January and April lows.
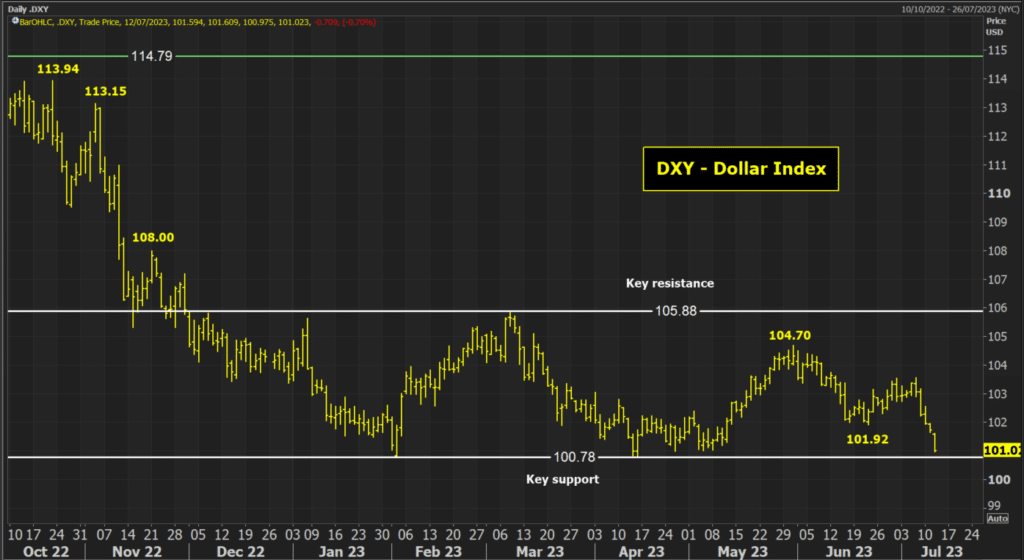
My previous assessment was that the USD would continue to trade in this fluctuating trading range of recent months between 100.78/105.88. However, the acceleration lower in the USD may just blow the support out of the water.
If we now have some dovish Fed speak towards the end of the week, it would leave USD traders very much on the back foot trading up until the FOMC meeting announcement on 26th July.
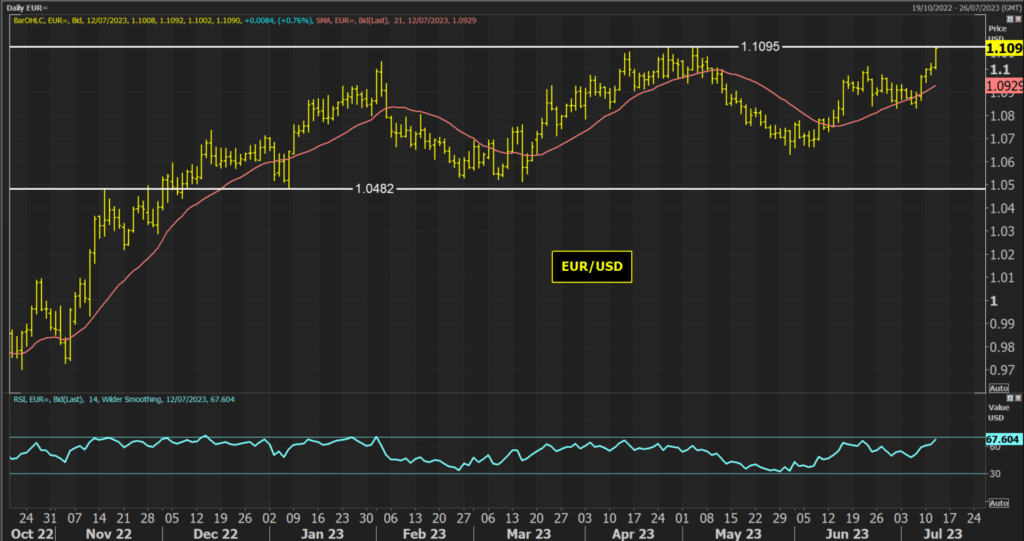
EUR/USD on the brink of a breakout
Looking at the technical analysis, the USD is coming under considerable selling pressure. GBP/USD has broken decisively above 1.2848 resistance in recent days and is now set to test 1.3000. However, the chart of EUR/USD is the interesting one, being on the brink of a breakout.
EUR/USD is now within sniffing distance of the 1.1095 key May high. The reaction to this resistance will be telling. The daily RSI is in the high 60s, suggesting strong momentum but also with room to push into the 70s. The rallies of December and January got into the low 70s before consolidation in the run higher. If there is a closing breakout above 1.1095 it would open 1.1185 as the next resistance but essentially brings the long-term resistance band 1.14/1.15 into view once more. The medium-term importance of the resistance band 1.0833/1.1010 is growing too.