Drops in the stock market are significant, not only to us as traders looking to avoid losses or short stocks, but also to the market as a whole. These drops usually occur due to a large negative piece of news or situations that causes investors to act out fear, changing the financial outlook of the economy.
Often these shocks impact everyone connected to that economy, whether directly via the loss of money through dropping stock prices or indirectly via multiple macroeconomic factors. Economies can also take a long time to recover to pre-crisis levels after such falls. This makes it important for us to have knowledge of these past crashes and hopefully help the economy as a whole anticipate future shocks or potentially even avoid them.
Stock markets do have some measures in place to attempt to prevent crashes, such as trading curbs and circuit breaks, which attempt to stop trading activity for a certain time period after stocks crash. However, these instruments can only be so successful and if confidence is not restored may do little to help the situation.
What Do We Mean by Largest?
In this case we are looking at how much the markets fell on any ONE given day. This means the stock values from when the markets closed on one day compared to when it closed on the previous day, in percentage terms. We define it in this way as if we used nominal values only recent shocks would appear due to stock price and index inflation.
What is the S&P 500
We are specifically looking at the S&P 500 which is a stock market index of the 500 largest companies listed on the United States stock exchange. The S&P 500 or Standard and Poor’s 500 was first introduced back in 1923 and is operated by S&P Dow Jones indices. It did not become formally recognised until 1957, meaning it may not be recognised by some sources prior to this date. We will still use data back until 1923.
By the end of 2020, the total amount invested in assets tied to the performance of the index was more than $5.4 trillion. It provides a good overview of how the markets are performing as it shows the largest companies in the world’s most influential economy, leading it to be one of the most popular equity indices for tracking stock performance. In the present day this index is extremely top heavy, with the top 9 companies on the list accounting for 27.8% of the market capitalization of the whole list.
These companies include Apple, Amazon, Alphabet and Microsoft which can all be found on our list of the 10 most valuable companies in the world. As these companies make up such a large proportion of the index today, any recent or future shocks to these firms will be reflected heavily by the index’s performance.
Largest Drops in S&P 500 History
| Rank | Date | Close | Net Change | % Change | Event |
| 1 | 19/10/1987 | 224.84 | -57.86 | -20.47 | Black Monday of 1987 |
| 2 | 28/10/1929 | 22.74 | -3.20 | -12.34 | Wall Street Crash of 1929 |
| 3 | 16/03/2020 | 2,386.13 | -324.89 | -11.98 | COVID-19 Pandemic |
| 4 | 29/10/1929 | 20.43 | -2.31 | -10.16 | Wall Street Crash of 1929 |
| 5 | 06/11/1929 | 20.61 | -2.27 | -9.92 | Wall Street Crash of 1929 |
| 6 | 12/03/2020 | 2,480.64 | -260.74 | -9.51 | COVID-19 Pandemic |
| 7 | 18/10/1937 | 10.76 | -1.10 | -9.27 | Recession of 1937-38 |
| 8 | 15/10/2008 | 907.84 | -90.17 | -9.04 | Global Financial Crisis 2007-08 |
| 9 | 01/12/2008 | 816.21 | -80.13 | -8.93 | Global Financial Crisis 2007-08 |
| 10 | 20/07/1933 | 10.57 | -1.03 | -8.88 | Stocks hit bottom after Wall Street Crash |
Data as of 2023 from Wikipedia
As we can see, some of these events caused multiple crashes on the list, due to the market crashing over a time period and not just a single day. We will explore what happened during these events that lead to such severe impacts to the market.
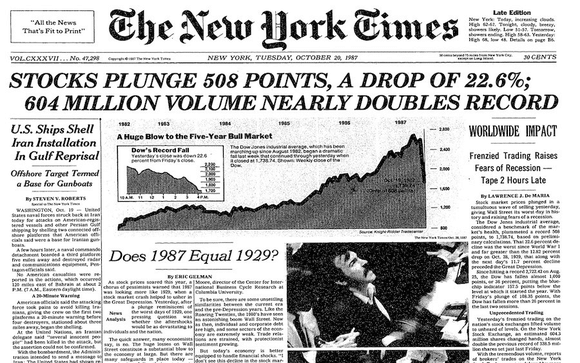
Black Monday of 1987
By far the largest one day drop in the history of the S&P 500 stock index occurred in October 1987, losing over 20% of the previous day’s closing value. This event became known as Black Monday. The U.S. crash was triggered by a larger-than-anticipated trade deficit and a falling dollar, causing market volatility and decreased investor confidence.
Asia, followed by New Zealand, Australia, Hong Kong, Singapore, and Mexico, saw markets plunge prior to the crash. Increased international investment activity in U.S. markets played a role in Black Monday.
Regulators then introduced reforms to address the structural issues that led to the crash, such as uniform clearing and settlement timelines for stocks, options, and futures markets. The trade-clearing process was improved, and the first circuit breakers were put in place to temporarily halt trading during significant price drops.
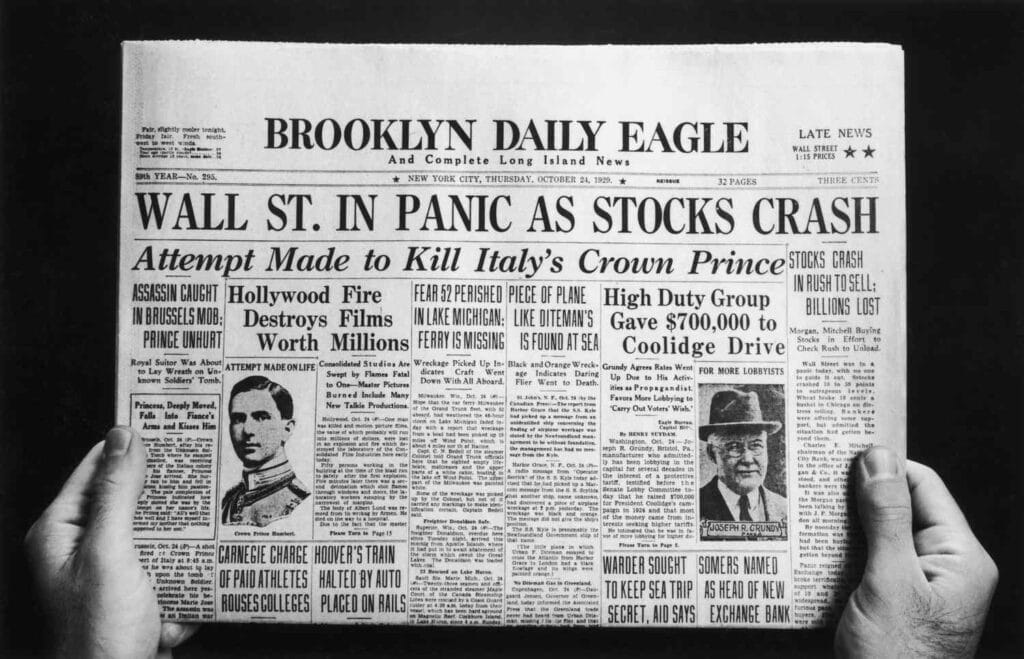
Wall Street Crash of 1929
As with many of the largest crashes the stock market has seen, the Wall Street Crash occurred after a bubble had formed in the previous years and months. A bubble refers to an economic cycle where there is a rapid increase in the prices on an asset. This was seen in 1929 where stock prices rose to unprecedented levels, with the Dow Jones Industrial Average (DJIA) having increased to over six times its value a few years prior.
However, the presence of a bubble means the asset is being overvalued, so must ‘burst’ at some point. This can be observed during the Wall Street Crash where there were four daily falls of the S&P 500s value that made our top ten list, finally reaching its rock bottom years later in 1933, where stocks had lost 90% of their value. This crash and overvaluing of stocks had severe economic impacts as it led to the decade long Great Depression and the DJIA did not recover to its pre-crisis levels for 25 years, in nominal terms.
The two most cited causes of the Wall Street Crash are an attempt to combat market speculation by Federal Reserve Banks governors and most of the Federal Reserve Boards, along with a large increase in unregulated investment trusts and public holding companies.
COVID-19 Pandemic
Responsible for the third and sixth largest crashes in the history of the S&P 500 was the beginning of the COVID-19 pandemic. Both of these falls of 11.98% and 9.51% occurred in March of 2020, merely days apart. It had become clear to the world, and especially Western countries, that COVID-19 had potential to spread worldwide and even halt the world’s economy.
There was still a lot of uncertainty about the consequences the pandemic would have as the world had not faced a global health crisis like this in the modern era. This was a driving factor in causing uncertainty and a lack of confidence from investors, worsened by the prospect of many economic activities being forced to delay or stop entirely. Many of these investors went to remove their money from these large companies, in a form of panic selling, putting downward pressure on many of their stock prices.
During these months NYSE trading was suspended multiple times to try to stop the fall. However the economy was able to recover relatively quickly as confidence returned, hitting record highs by August 18th of the same year.

Recession of 1937-38
The largest single day fall during this crash comes in seventh place on our list with a fall of 9.27%. This recession occurred during the period after the Wall Street Crash, when the economy was still recovering from the Great Depression. The main cause of the recession is thought to be the contractionary fiscal policies employed by the Federal Reserve and Treasury Department. This caused a contraction in the money supply, restricting access to credit along with many other microeconomic implications. On a macro level, unemployment increased to 20%, after significant recovery since 1929, and GDP fell over 10%. The recession ended once the Fed and Treasury flipped their policy to become more expansionary.
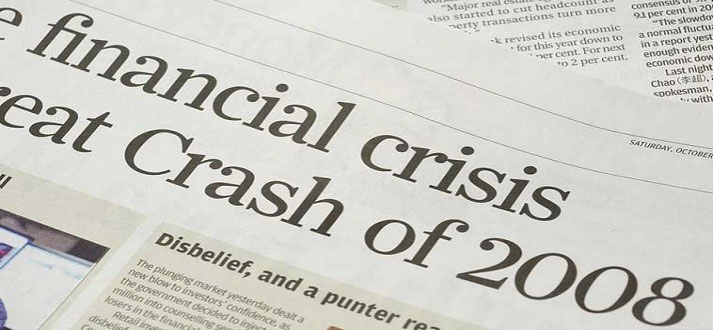
Global Financial Crisis of 2007-08
The Global Financial Crisis led to the seventh and eighth largest crashes in S&P 500 history by percentage, and resulted in the largest nominal drop at the time. By early 2009, the DJIA had fallen to 50% of its pre-crisis level. The unstable economy continued to experience crashes in the years following, such as in March 2010 and August 2011.
The crash was a result of many factors in the economy combining to create a housing bubble. Banks were largely at fault, employing subprime mortgage lending practices and using new complex financial products to sell to investors globally, while showing poor risk management, often caused by moral hazards. This was made worse by loose monetary policy making credit easy to come by and the lack of regulation reducing accountability. The interconnectivity of the global economy and insufficient protections between banks led to the rapid spread of recession when the bubble burst and defaults occurred.
The immediate cause of the market crash was Congress’ initial rejection of the bank bailout bill, which aimed to stabilise the financial system after historic shocks. The bill was eventually passed on October 3rd 2008, as further banks defaulting would have destabilised the system further and made the recession worse. If you want to learn more about the Global Financial Crisis, you should watch The Big Short, on our list of the Top 10 Trading Movies!
Market Crash Takeaways
We trust you have learned some lessons from our details of the 10 Largest Drops in S&P 500 History. Stock markets do not always go up, and when they go down, they can fall hard and fast! So as the old adage says, “caveat emptor”, or “buyer beware.”
