What are the Stochastics?
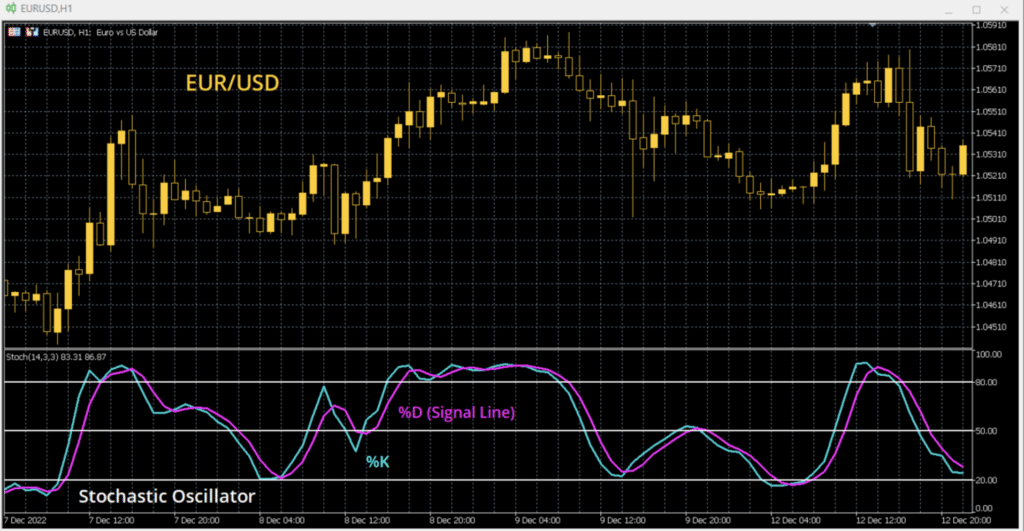
The Stochastic Oscillator, or Stochastics for short, is a technical analysis momentum indicator developed by George Lane in the 1950s. It is a two-line indicator comprising the Stochastic Oscillator (%K) and a Signal Line (%D). The indicator looks at the latest closing price measured against the price range over a specified period (traditionally the last 14 periods).
As an oscillator, the indicator moves between 0 and 100. Classically, Lane saw moves either below 20 or above 80 as becoming extreme. Subsequently, the levels and movement of the two lines can generate signals and be an indication of subsequent price moves.
The Stochastics can be useful for traders as they can help to identify certain trading conditions:
- Overbought/Oversold
- Buy signals and Sell signals
- Divergences
The calculation
Here is the original calculation for the Stochastic Oscillator (%K) which used prices over the last 14 periods:
| %K = | ( | C – L14 | ) | x 100 |
| H14 – L14 | ||||
| Where: | ||||
| %K = | The value of the Stochastic Oscillator | |||
| C = | The most recent closing price (or last price) | |||
| L14 = | The lowest price of the past 14 periods | |||
| H14 = | The highest price of the past 14 periods | |||
The Signal Line (%D) is then added, which is a 3-period moving average of %K.
| Signal Line | %D = 3-period SMA of %K |
However, the original calculations of the Stochastics Oscillator were seen as highly volatile. They became known as the Fast Stochastics. They were smoothed by another 3-period simple moving average to become the Slow Stochastics.
Fast Stochastic Oscillator:
- Fast %K = the original %K calculation
- Fast %D = 3-period SMA of %K
Slow Stochastic Oscillator:
- Slow %K = 3-period SMA of original %K
- Slow %D = 3-period SMA of Slow %K
Most charting software will default to the Slow Stochastics with the parameters set at 14, 3, 3 (although you can usually change the parameters of the calculations). The rule tends to be the more data in the calculation, the less sensitive it is to current price movements.
Overbought/Oversold
As with other momentum indicators, trending moves in the Stochastics are a signal. Trending above 50 moves the price towards a bullish configuration. Trending below 50 becomes more bearish.
However, the primary signals come at extreme levels. As we have already mentioned, Geroge Lane saw moves below 20 or above 80 as being extreme.
- Moves below 20 are seen as becoming oversold
- Moves above 80 are seen as being overbought
Buy and Sell Signals
There is some debate over when signals should be taken. Buy and sell signals should be taken either below 20 (for buy signals) or above 80 (for sell signals). The trigger is the Signal Line crossing the %K line.
- Buy signal – The lines are both below 20 and the %K line crosses above the Signal Line
- Sell signal – The lines are both above 80 and the %K line crosses below the Signal Line
However, this situation can happen often as the lines oscillate around the extremes. For the best confirmation of the trading signals, we look for the lines to cross back above 20 (for a buy signal) or below 80 (for a sell signal).
Stochastics divergences
The Stochastics are a momentum indicator and subsequently, the lines can sometimes show divergences from the price. These divergences can be indications of slowing momentum.
- Bearish Stochastics divergence – In an uptrend, the price is making higher key highs, but the Stochastics lines are making lower highs.
- Bullish Stochastics divergence – In a downtrend, the price is continuing to make lower highs, whilst the Stochastics lines are starting to make higher lows.
