Trading indicators are an important area in technical analysis and are used in conjunction with the actual price action. Technical trading indicators are mathematical calculations or algorithms broadly based on three inputs; price, volume and time. They are visual representations that you can use to help in deciding the future direction of price, alongside other technical analysis factors such as trendlines, patterns and candlesticks.
In this article we’ll explain how trading indicators work, how you can use them and why trading indicators are so significant. Plus, what you should know to be able to use them in your trading strategies and what are the different groupings of trading indicators.
Trading Indicators Explained
Technical trading indicators are usually displayed below the price chart but can also be displayed on the same chart as the price. An example of a trading indicator that is displayed below the price chart is a Relative Strength Index, or RSI. Probably the most notable trading indictor that is displayed on the actual price chart with the price movements are the Moving Averages.
You can see these displayed in the chart below.
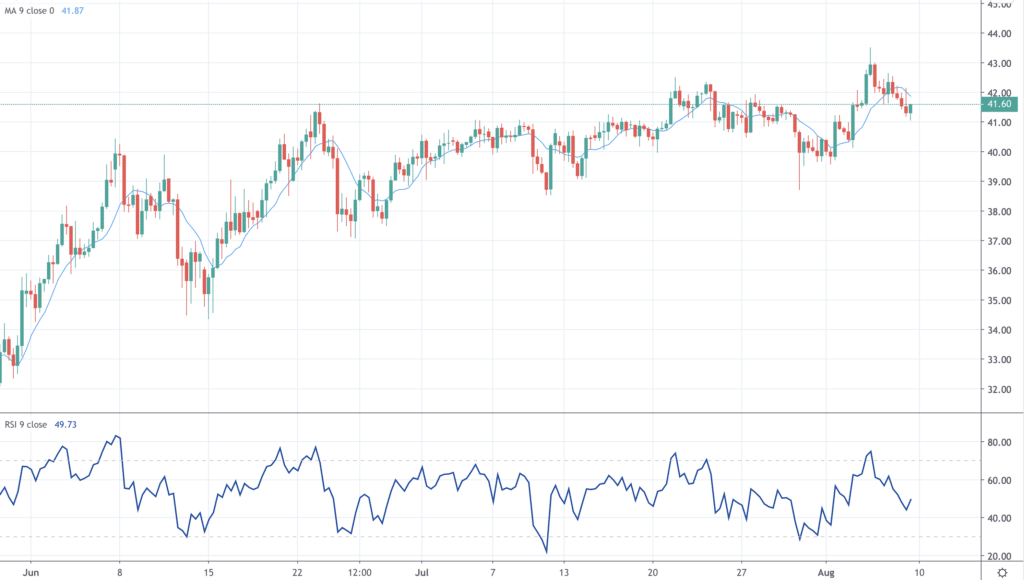
As highlighted above, technical trading indicators are a graphical representation of a mathematical formula, applied to either the price data over time, or a combination of price, volume and time data.
Forex Trading Indicators
When it comes to Forex markets, we would use the same trading indicators as used in most other financial market asset classes. The main two differences with Forex markets when it comes to technical indicators are:
- Forex markets are 24 hours
- Forex markets volume data is not centralised
Foreign exchange markets are categorically 24-hour markets, opening in Asia at the start of the global week on a Monday morning (which is Sunday night European time) and not closing until Friday afternoon New York time (Friday evening European time). Given that the price data between these times is uninterrupted and continuous, it means that Forex trading indicators are often “smoother” when compared to other financial markets that close (such as individual stocks). Markets that have defined opens and closes during the week can see jumps in their price data and, therefore, jumps in their respective trading indicators.
Volume indicators in particular tend to be less useful when applied to the global Forex markets, because of the non-centralised nature of these markets. Foreign Exchange transactions are not conducted vias a central exchange but are made across various trading platforms. This means that accurate volume data is not readily available, meaning that volume trading indicators are less reliable when applied to the currency markets.
How Do Trading Indicators Work?
Trading indicators work by helping you in making trading decisions with regard to your strategy and trading tactics.
We’d stress here that technical trading indicators are secondary in nature when it comes to making trading judgments. Primary indicators are those that come directly from the price, which would mean for example looking at chart patterns, candlestick patterns, trendlines and trends. Technical indicators should be used as secondary indicators, an extra piece of evidence that you can add onto your trading decisions and strategies, to supplement the views that you’ve formed from using the primary indicators.
How To Use Trading Indicators
There are a number of ways in which trading indicators can be used. These would include:
- A measure of overbought and oversold market conditions
- For confirmation of underlying price action
- With respect to divergence, when a technical indicator and the price action are sending differing signals
- Direct trading signals around which a strategy can be built
Overbought and oversold: Some technical trading indicators are constructed at measuring when a market has moved too far in one direction, either in an uptrend or in a downtrend. These would include trend and momentum trading indicators, plus to a lesser extent Moving Averages.
Trading Indicator confirmation: Confirmation occurs when a market is moving in one direction and the chosen technical trading indicator is also moving in the same direction, thereby confirming the primary price action.
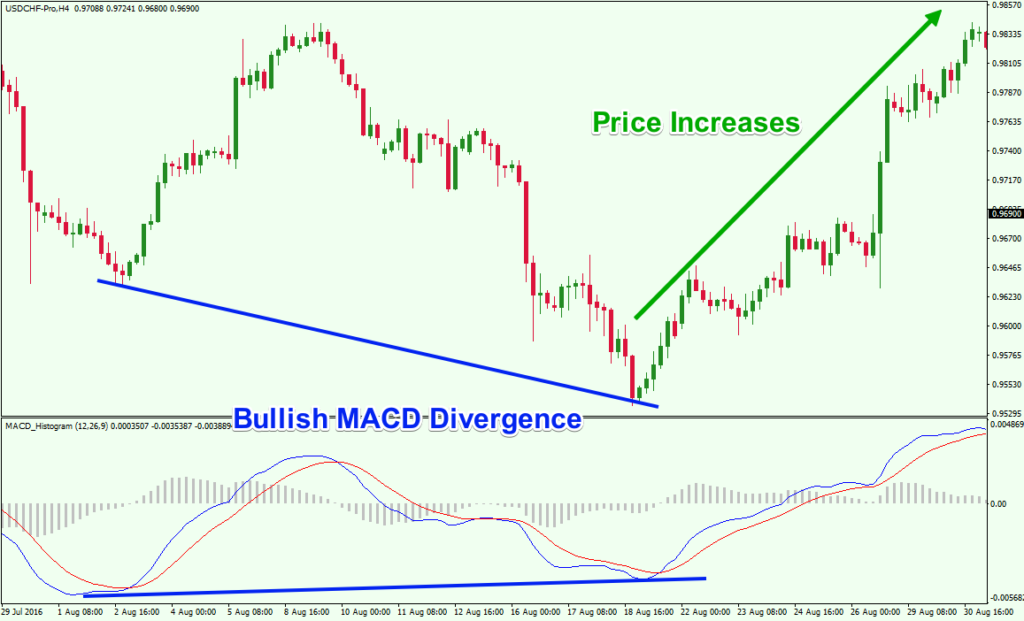
Trading Indicator divergence: Divergence is when a trading indicator is giving a different directional signal to the price. This can then be seen a warning that price may be about to change direction.
Trading signals: You may build a whole trading system and strategy entirely around technical indicators. This would involve either using a single indicator or possibly various indicators together, perhaps combined with primary indictors such as chart patterns or trendlines. This would be in order to define a trading strategy based on trading indicators.
Why Are Trading Indicators Important?
Trading indicators are important because they give you another input to your trading strategy that can help to either reinforce your trading view, or possibly to counter a trading idea that you may have.
For example, you may have a bullish trading view on a market, but you are not fully confident in taking this trade. However, should a trading indicator reinforce this view, it could give you an extra valuable piece of information to tip you towards taking the trade.
Conversely, you may for example have a bearish idea for a trade and are quite confident with this view. But, if the technical indicator does not confirm this view, it may cause you to be more cautious when entering this trade. You and wait for a more significant confirmation signal from the price action.
What Should You Know Before Using Trading Indicators?
Technical trading indicators usually fall into two main categories; whether they are leading indicators or lagging indicators. Leading technical indicators try to predict future price moves. Lagging trading indicators, however, reflect past trading conditions that could be influencing the current price action and therefore future price movements.
Although we define these two broader categories, trading indicators can also fall into further subcategories, which we will now look at, the different types of technical indicators.
What Are The Different Types Of Indicators?
There are a number of differing categories of trading indicators. These include:
- Trend indicators
- Momentum indicators
- Volatility indicators
- Volume indicators
- Moving Averages
We’ll now look at these different types of trading indicator categories separately.
Trend Indicators
Trend indicators are, generally speaking, lagging indicators and reflect the overall direction of a market over a defined timeframe. Whether the market is moving in an uptrend, a downtrend or a sideways, non-trend, range environment.
The best examples of trend indicators would be the various Moving Averages, which we will start to look at in a little more detail below.
Momentum Indicators
Momentum indicators are leading indicators and are a measure of the velocity of price changes with respect to time. They can be thought of as the amount of speed, force, pressure or power that the market is expressing in a particular direction, over a specified timeframe.
A good example of a momentum indicator would be the Moving Averages Convergence Divergence, better known as the MACD indicator (pronounced Mac Dee).
Volatility Indicators
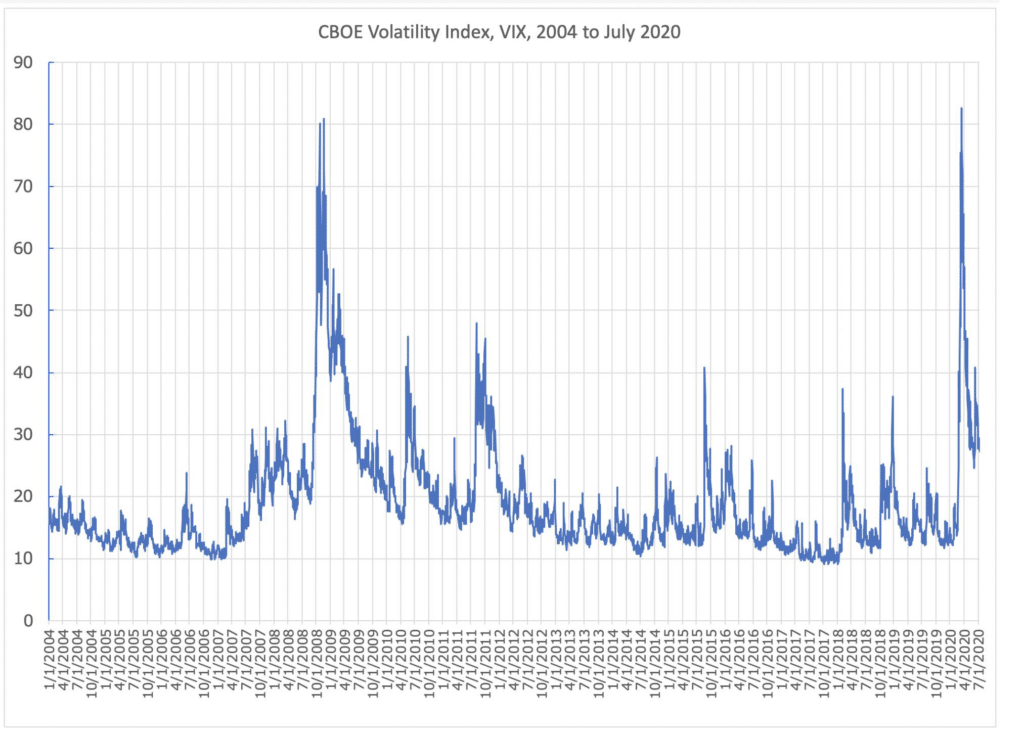
Volatility is a somewhat complex indicator and measures the degree of variation of the price of a financial market. It is a measure of the dispersion or distribution of returns of a financial market asset or asset class. Broadly speaking, the higher the volatility is, the riskier the financial asset is and the more uncertain are the returns. Higher volatility means that price of the market can change significantly over a short period, in either direction. Conversely, low volatility implies a safer asset, where price fluctuations tend to be less aggressive.
Examples of a volatility indicators would be the CBOE Volatility Index, better known as the VIX (see the chart below) and the Average True Range (or ATR).
Volume Indicators
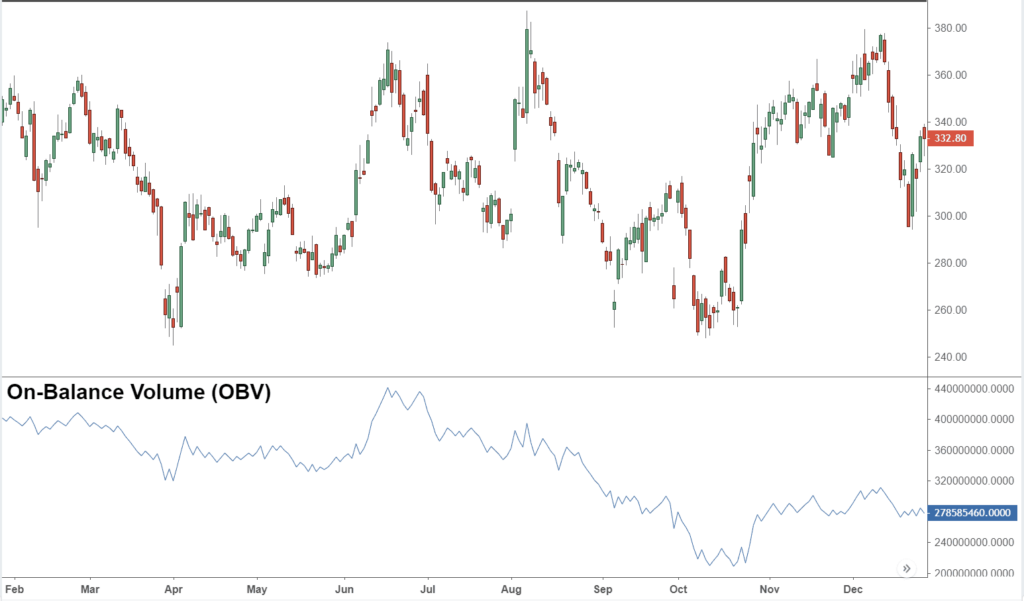
Volume indicators usually look at the volume in the market over a set period of time. Volume is a measure of the number or size of transactions being made at differing prices. Sometimes, the volume and time data is also combined with price data for more complex volume indicators.
The simplest example of a volume indicator would be the Volume itself; this is how much a market has traded in a certain time period. A more complex example of a volume indicator would be On-Balance Volume, or OBV, shown in the chart below.
Moving Averages
Moving Averages are a specific form of trend indicators but are deserving of their own category as they are widely used in technical analysis as indicators.
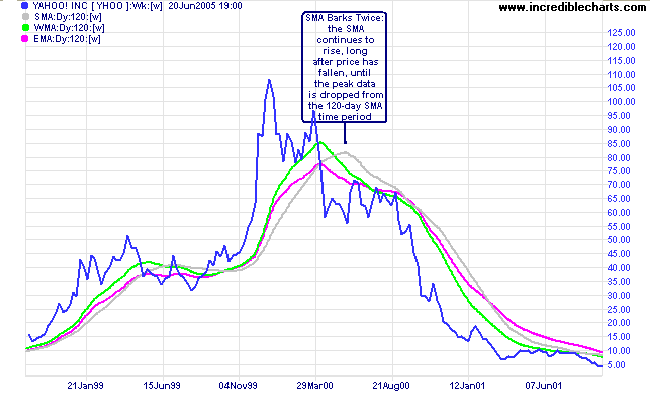
There are three main types of Moving Averages:
- Simple Moving Averages
- Weighted Moving Averages
- Exponential Moving Averages
We explore Moving Averages in more detail in the article What Are Trading Indicators Part 2. You can see all three types of Moving average on the chart below.
Trading Indicators Summary
In this article we have looked at what trading indicators are how they work, how to use them, why they are important, what you should know before using them and the different categories of trading indicators. This should give you the basis to start to lose use trading indicators within your trading strategies. To help you too decide which trading indicators to use, check out What Are Trading Indicators Part 2.
