Welcome to the dynamic world of trading, where success often hinges on the ability to read between the lines of market trends. In this exploration, we take a look at the fascinating realm of technical analysis, a cornerstone for traders seeking to navigate the intricate landscape of financial markets.
Today, our focus is on momentum—a powerful force in the trading universe. Momentum, in the context of trading, goes beyond the physics textbooks; it’s a key indicator of a financial instrument’s strength and direction. As we embark on this journey, we’ll unravel the mysteries of various technical analysis tools specifically designed to measure momentum. These tools, when wielded with finesse, can empower you to anticipate trend shifts, spot potential reversals, and make informed decisions in the fast-paced world of trading.
- Understanding Momentum in Trading
- Popular Momentum Indicators
- Relative Strength Index (RSI)
- Moving Average Convergence Divergence (MACD)
- Stochastic Oscillator
- Momentum Indicator (Rate of Change)
- Real World Application
- Choosing the Right Tool for You
- Final Thoughts on Tools that Measure Momentum
Understanding Momentum in Trading
In the fast-paced realm of trading, momentum is the heartbeat that pulses through financial instruments. Simply put, momentum measures the speed and strength of a price movement. When an asset gains momentum, it signifies a potential continuation of its current trend, while a loss of momentum might indicate a forthcoming shift.
Imagine momentum as the wind in a sail, propelling a ship forward. In trading, this force is quantified through various indicators that gauge the rate of price change. Understanding momentum is akin to deciphering the language of the market, allowing you to grasp not only where an asset stands but also where it might be headed.
Momentum becomes particularly vital when identifying potential reversals. Picture a runner on a track: as they approach the finish line, their speed might decrease, giving others a chance to catch up. Similarly, in trading, recognizing a slowdown in momentum can be a precursor to a trend reversal.
Popular Momentum Indicators
Relative Strength Index (RSI)
Now, let’s embark on the first leg of our journey into the world of momentum indicators with the Relative Strength Index (RSI). Think of the RSI as your market fitness tracker—it measures the speed and change of price movements. RSI is like a silent messenger, indicating whether an asset is overbought or oversold.
The RSI is a versatile oscillator that quantifies the speed and change of price movements. Its values range from 0 to 100, with readings above 70 signalling overbought conditions and those below 30 indicating oversold territory.
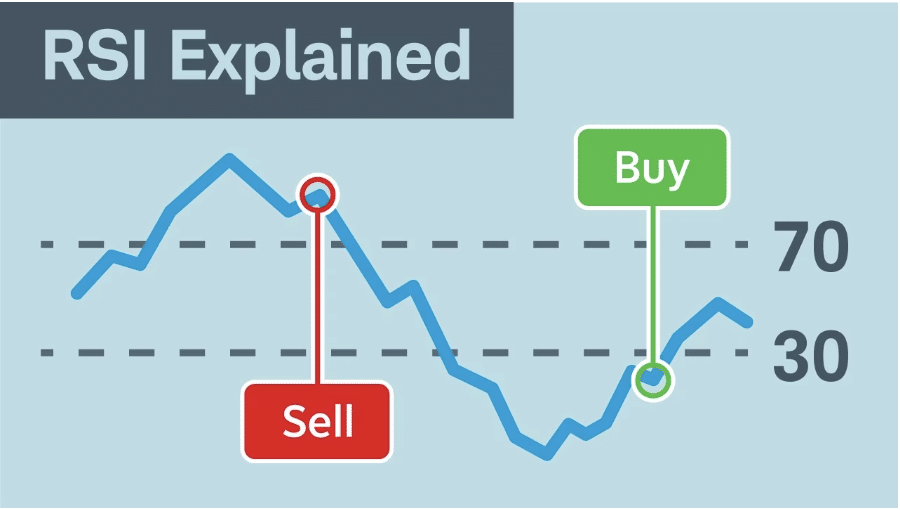
Picture RSI as a traffic light for traders. When it turns red (above 70), it suggests the market might be overbought, and a reversal could be on the horizon. Conversely, a green light (below 30) indicates potential oversold conditions, signalling a potential buying opportunity.
To put it into perspective, consider a stock with an RSI of 75. This signals potential overbought conditions, suggesting caution. On the flip side, an RSI of 25 might indicate oversold conditions, presenting an opportunity to explore.
Moving Average Convergence Divergence (MACD)
Our next destination in the realm of momentum indicators is the Moving Average Convergence Divergence (MACD). MACD is like a compass guiding you through the seas of trends, helping traders identify potential trend changes and the strength of existing trends.
The MACD is a trend-following momentum indicator that showcases the relationship between two moving averages of an asset’s price. Its main components are the MACD line, signal line, and histogram.
Watch for the MACD line crossing above the signal line—a bullish signal indicating potential upward momentum. Conversely, a MACD line crossing below the signal line suggests potential bearish momentum. The histogram, a visual representation of the difference between the MACD and signal line, adds depth to this interpretation.
MACD not only helps identify trends but also offers insights into their strength. Additionally, divergences between MACD and price can be early indicators of potential trend reversals.
Stochastic Oscillator
As we continue our exploration, we encounter the Stochastic Oscillator—a tool designed to measure the momentum of price. It’s like a heartbeat monitor for your trades, revealing the rhythm of price movements.
The stochastic oscillator compares an asset’s closing price to its price range over a certain period, revealing the momentum behind price movements. It operates on a scale from 0 to 100.
The %K line represents the current market rate, while the %D line is a smoothed version of %K. Crossing above 80 suggests overbought conditions, and below 20 indicates oversold conditions.
By using the stochastic oscillator, traders can identify potential turning points in the market. When %K crosses above %D, it signals a potential buying opportunity, while a cross below might indicate a potential sell signal.
Momentum Indicator (Rate of Change)
Our expedition through momentum indicators wouldn’t be complete without stopping at the Momentum Indicator itself. Think of it as the pure essence of momentum, distilled into a single numerical value. This indicator provides traders with a straightforward yet powerful tool for gauging the strength of a price trend.
The Momentum Indicator measures the rate of change of a financial instrument’s price. Essentially, it’s like putting a speedometer on price movements. It’s not just about knowing where the price is; it’s about understanding how fast it got there. The only difference between the momentum indicator and the rate of change (RoC), another indicator, is the RoC adds 100 to the value. MOM uses 100 as its centre line instead of zero.
The indicator displays a single line that moves above or below a baseline. When the line is above the baseline, it suggests upward momentum. Conversely, when it’s below, it signals downward momentum. The steeper the incline or decline, the stronger the momentum.
The Momentum Indicator shines in highlighting periods of rapid price change. Traders often look for divergences between price movements and the momentum indicator as potential signals of a trend reversal.
As we wrap up our exploration of these momentum indicators, each tool brings its unique flavour to the trading table. Experimenting with these indicators and understanding their nuances will empower you to interpret the language of momentum with finesse.
Real-World Application
Now that you have gained knowledge about the specific momentum indicators it’s time to use them in the markets in a practical sense. Use these tools to spot potential entry and exit points, confirm trend directions, and stay ahead of market shifts.
Consider combining these indicators for a more comprehensive view. When multiple indicators align, it can strengthen your convictions about a particular trade. However, always remember that no tool is foolproof, and a holistic approach to analysis is key.
Choosing the Right Tool for You
In the vast landscape of momentum indicators, selecting the right tool for your trading style is akin to choosing the right instrument for a musician. It’s a personal decision influenced by your preferences, risk tolerance, and the tune of the market.
Think about your trading style. Are you more inclined towards short-term trades or long-term investments? Different indicators suit different timeframes, so align your choice with your preferred trading horizon.
Your risk tolerance and the prevailing market conditions also play a pivotal role. Some indicators might be more sensitive and yield more signals, which can be advantageous but may also lead to false alarms. Understand the balance between sensitivity and reliability.
The beauty of trading is the ability to experiment. Try different combinations of indicators, tweak your parameters, and observe how they react in different market conditions. Your journey to finding the ideal tool is a dynamic process that evolves with experience.
Final Thoughts on Tools that Measure Momentum
As we conclude this journey through the world of momentum indicators, remember that these tools are your allies in the ever-changing landscape of trading. They are not magic wands but sophisticated instruments that, when wielded with understanding and finesse, can significantly enhance your decision-making prowess.
In the dynamic world of trading, adaptability is your greatest asset. The markets are in constant flux, and your ability to navigate through uncertainty will define your success. Embrace the challenges, stay curious, and keep learning.
Happy trading!
