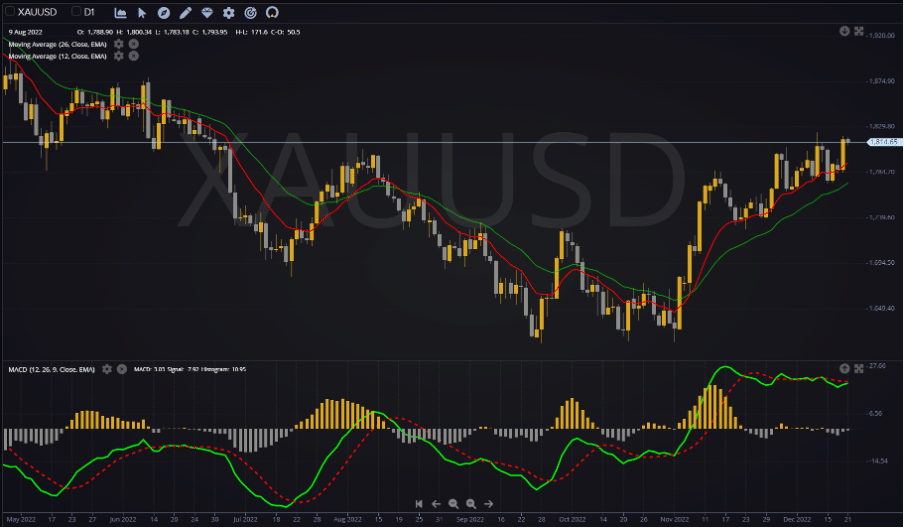
What is the MACD?
The MACD (Moving Average Convergence/Divergence) is an indicator that combines two forms of analysis, trends (using moving averages) and price momentum. The indicator is traditionally constructed by using two exponential moving averages calculated over 12 periods and 26 periods.
The indicator uses two lines (the MACD Line and the lagging Signal Line) and can also be accompanied by the MACD Histogram.
The MACD lines can be useful for traders as they can help to identify certain trading conditions:
- Buy and sell signals using MACD crossovers
- Overbought and oversold signals using extreme moves
- Signs of a slowing trend using divergences
Just like moving averages, the MACD indicator works best in trending markets.
The calculations
The MACD is made up of three elements. Firstly, here is the calculation for the MACD Line which uses two exponential moving averages.
| MACD Line = | 12-period EMA – 26-period EMA |
The Signal Line is then added. This lags the MACD Line because it is a 9-period moving average of the MACD Line.
| Signal Line = | 9-period EMA of the MACD Line |
Finally, the MACD Histogram can also be added. This is the difference between the two lines.
| MACD Histogram = | MACD Line – Signal Line |
Using the MACD and the MACD Histogram
Here are a few observations of the movements in the MACD:
- The Signal Line will always lag the MACD Line
- When the 26-period EMA is above the 12-period EMA, the MACD Line will be positive (above zero).
- When the 26-period EMA crosses the 12-period EMA the MACD Line will be zero
- When the MACD Line is above the Signal Line, the MACD Histogram will be positive (above zero)
- The point where the MACD Line crosses the Signal Line is where the MACD Histogram will be zero.
Crossovers
The primary signals that come from the MACD indicator are crossovers. These can be used to generate buy and sell signals. The buy signals work best after a period of decline (i.e. a downtrend), with the signal of a change in market direction. Similarly, the sell signals work best following a run higher in the MACD lines during an uptrending market.
- Bullish crossover (buy signal) – The MACD Line crosses above the Signal Line. This is represented by the MACD Histogram crossing above the zero line and moving into positive territory.
- Bearish crossover (sell signal) – The MACD Line crosses below the Signal Line. This is also represented by the MACD Histogram crossing below the zero line and moving into negative territory.
Overbought/Oversold
As with other momentum indicators, the MACD can be used to reflect overbought and oversold conditions. However, there is no exact science to these signals. It is a subjective assessment of how extreme the lines are compared to historic moves.
- The signal that an oversold market is turning would be the MACD Line turning higher from an extreme low.
- The signal for an overbought market turning would be the MACD Line turning down from an extreme high.
This is effectively an early warning of a potential crossover.
MACD divergences
Divergences are also a feature of MACD signals. As with other momentum indicators, traders will be looking for higher highs or lower lows in the price not being matched on the MACD lines. This can be an ongoing signal and is just an early warning of a trend reversal.
- Bearish MACD divergence – In an uptrend, the price is making higher key highs, but the MACD lines are making lower highs.
- Bullish MACD divergence – In a downtrend, the price is continuing to make lower highs, whilst the MACD lines are starting to make higher lows.
The MACD Histogram can also be used for divergences. If the price is rising whilst the MACD Histogram is falling then it can be taken as an early signal of a bull trend that is losing upside momentum and is close to reversing lower.
MACD limitations
The MACD is a very good indicator to use in a trending market. However, when the market loses a trend and moves sideways, this can result in the MACD giving false signals as the lines oscillate around the zero line. False signals are a feature of trading with moving averages in a ranging market.
