Moving on from our previous article on trading charts, the study of chart patterns is an area of technical analysis that deals with the patterns formed by the price movements on the charts. It is possible to identify these patterns on many different timeframes, from one-minute charts, through one-hour charts, to daily, weekly, and even monthly charts. Furthermore, these chart patterns are formed across practically all asset classes — you can find stock chart patterns, on share indices, commodity markets, bond markets and forex chart patterns. These patterns have been seen throughout history from decades ago, even hundreds of years ago, where different patterns can be identified which are still relevant today.
How do Chart Patterns Work?
Chart patterns work because of two of the connected principles of technical analysis.
- Patterns repeat
- It is possible to identify and profit from chart patterns that are forming in the current market.
- This is because what has happened previously will likely happen again.
- Price patterns that have occurred in the past do not always replicate precisely in the current time, but many times these patterns do give similar outcomes.
- History repeats
- The reason that history tends to repeat itself is that the one constant in markets across time is the interaction of humans that drive market prices.
- Different macroeconomic, fundamental and geopolitical events are the drivers of price action
- But it requires human interaction; the thoughts, emotions, and behaviours of the individual traders and investors acting as a group that causes markets to go up or down in price.
Technical analysis chart patterns, therefore, are a reflection of human emotions, behaviours and psychology. These will tend to repeat themselves over time. Human emotions don’t change. You still get angry, nervous, excited. Therefore, it’s not surprising that we can apply these emotions to a chart and predict possible future market moves.
Understanding Chart Patterns
To properly understand chart patterns, it is necessary for you to be able to learn the different patterns.
- You will need to learn their potential for signalling either a more bullish or more bearish bias for any particular financial market.
- You will also need to understand why they work. It is necessary to appreciate the psychological and behavioural reasons that any particular pattern might be a bullish or bearish pattern.
- Chart patterns don’t only provide the trader with the likely direction for the market, but also potential price targets (derived from the patterns).
Why are Chart Patterns Important?
- Chart patterns are important because for a technical analyst or trader as they give a defined framework for you to decide whether to buy or sell.
- Patterns are essential, even if they’re not your primary technique, it’s still recommended to have them in your trading armoury.
- Chart pattern analysis helps find trading setups. These provide defined price objectives and defined exit levels (that is, stop-loss placements).
- From your perspective, it’s definitely possible to learn patterns like the pros. This means that you’ll be on the same level as an institutional trader when it comes to technical analysis and identifying chart patterns.
- Chart patterns can be used with individual stocks, index stock patterns, forex chart patterns or across any number of financial markets assets or asset classes. All that is required is for markets to be liquid and not to be significantly influenced by any large participant from either the demand or the supply side.
What is Pattern Recognition?
Pattern recognition is simply the process of identifying trading chart patterns by looking at the charts. For most technical analysts and traders, this is done subjectively. That is to say, the individuals educate themselves about the various chart patterns, by looking at pattern recognition examples. The analysts or traders are then, over time, able to gain an insight that enables them to identify the various trading chart patterns and hopefully to benefit from placing trades in respect of the chart pattern recognition.
There are also automated chart pattern recognition software programs available that can automatically identify various chart patterns. It is up to the individual if they are willing to take the automated trading chart pattern recognition route. Still, we would suggest that it would also be useful to also have a good understanding of the chart patterns.
What is Consolidation in trading?
Consolidation in trading is when a market goes sideways. This can be over any particular time frame and is opposite to a trending market (either higher or lower). A consolidation phase is when the market is not trending and caught between support and resistance levels. Most chart patterns occur after the market has been in either an upward (bull) or downward (bear) trend, then enter into a consolidation phase. Depending on the chart patterns that is formed in the consolidation, there is a likelihood for the market to break from the consolidation range, either higher or lower.
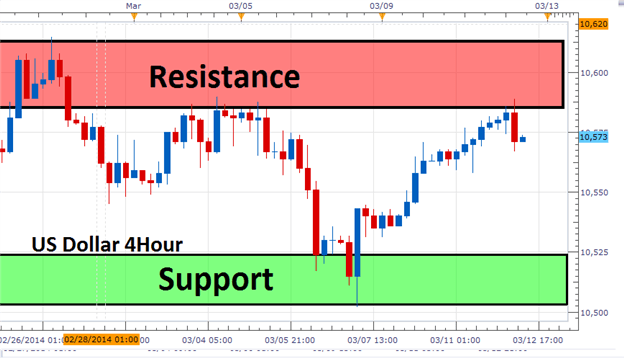
What is Range Trading?
Range trading is when a technical trader identifies that a market has moved into a consolidation.
- Rather than waiting for the market to break out from the consolidation range, you might decide to enter trades within the trading range.
- The range trading strategy requires you to identify the bottom of the trading range by and the top of the range.
- The range trading strategy would then be to look to enter shorts (to sell) at the upper end of the range, in the region of identified resistance levels.
- Or, to enter longs (to buy) at the lower end of the range, at defined chart pattern support levels.
What are the three Main Groups of Chart Patterns?
There are three main types of chart patterns — reversal, continuation and bilateral patterns. See below for details on each.
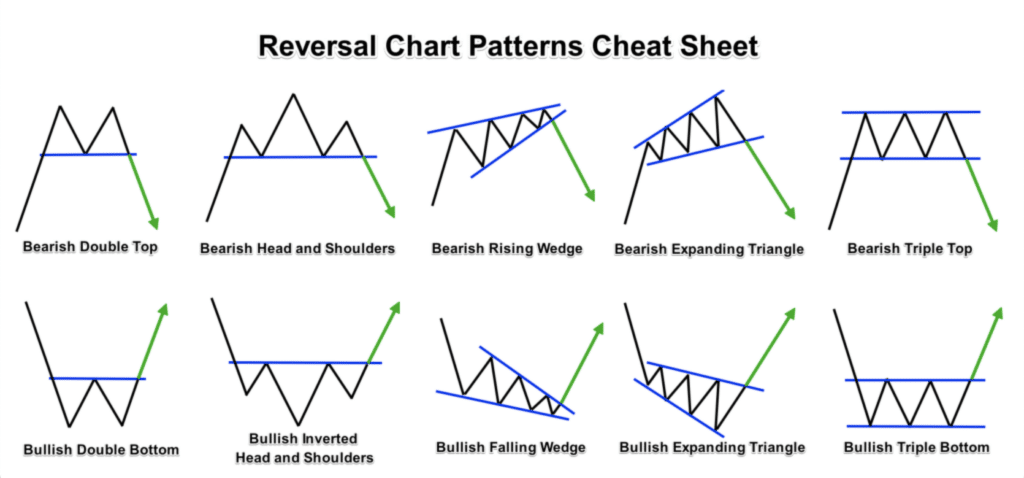
Reversal Chart Patterns
Reversal patterns are found at the top of uptrends and the bottom of downtrends.
So, for example, if a market was in an uptrend and then went into a consolidation phase, we would look to use pattern recognition to identify the pattern as a potential reversal chart pattern. That would then indicate that the bull trend is likely to be coming to an end. If you were long (had already bought the market), then you would consider exiting the long position. Or, when the reversal chart pattern had given the correct signal, you might consider entering a short (sell) position.
Conversely, if there was a bear trend and the market indicated a reversal chart pattern, and if you were already short in your positioning (had sold the market), then you might consider exiting the short position. Or, you might consider entering a long (buy) position. Examples of reversal patterns include Double Tops and Double Bottoms, Head & Shoulders and Inverse Head & Shoulders patterns. We will look at these far more closely in our section What are Chart Patterns? Part 2.
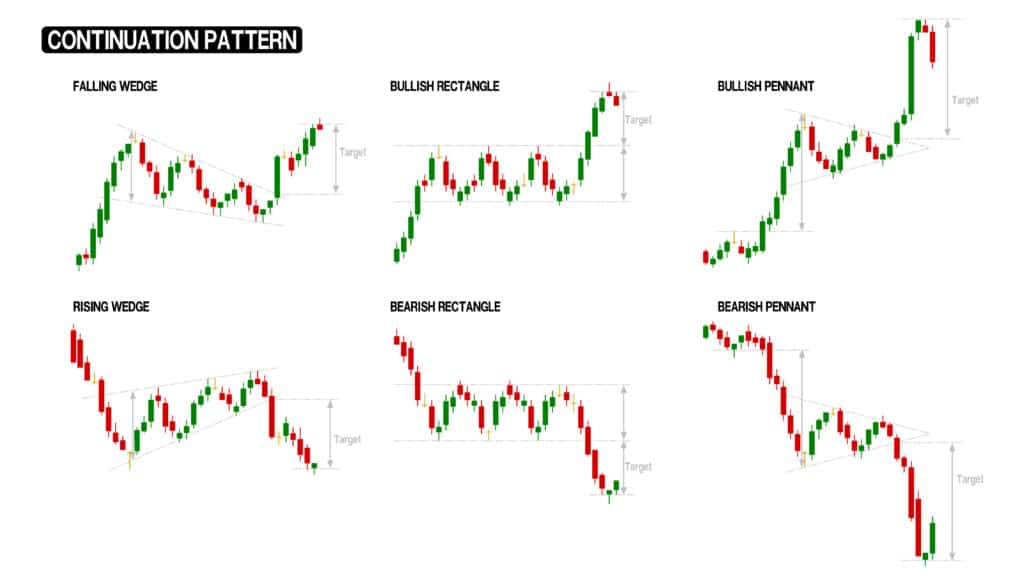
Continuation Chart Patterns
Continuation chart patterns are when the market is in either a bull or bear trend and then goes into a consolidation phase.
- You then look then identify the continuation chart pattern, which would indicate that the market is likely to continue in the direction of the original bull or bear trend (up or down respectively).
- You would then look to build a strategy for a continuation of the underlying trend, once the continuation chart patterns had completed with a signal.
Examples of continuation chart patterns include Rectangles, Pennants and Flags, which again, we will look at in more detail in our section What are Chart Patterns? Part 2.
Bilateral Chart Patterns
Bilateral chart patterns can resolve in either direction, so can be both reversal chart patterns, and or continuation chart patterns. They tend to be less defined compared to the reversal and continuation chart patterns, with the potential to break either higher or lower from the consolidation phase. Examples of bilateral chart patterns are Symmetrical Triangles, plus Rising and Falling Wedges, which we will look at in our section What are Chart Patterns? Part 2.
