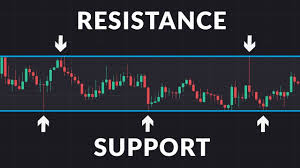
Two of the main concepts in trading and technical analysis are support and resistance. In basic terms, support and resistance are a specific price levels or areas of price that acts as barriers to a market price moving through them.
It is a simple concept but identifying these levels can trip you up sometimes. Here are support and resistance explained.
Support explained
Support is a price level or zone that is below the current market price. It should, or could, stop the price falling further. That’s because we expect an increase in demand at this level, which would prevent the market price dropping below the support line. So, support levels tend to act as a floor for market prices, encouraging markets to rebound from or from above the identified support.
Resistance explained
A resistance level or price resistance zone is found above the current market price, which would be expected to stop upward price movements. It would be expected that an increase in supply would overcome demand at a resistance level (or area). This would then encourage the price to stop at or below the resistance (level or zone). When we look at resistance, we are looking at potential ceilings to market price action.
How Many Levels of Support and Resistance Are There?
There are many levels of support and resistance. There are many different ways in which you can identify support levels (or zones) below the market and resistance levels (or areas) above the current market price. We will look here at the main ways to identify the different support and resistance levels, with different traders and analysts having their own individual approach. There is a discretionary element to producing support and resistance levels. We will look here at the main ways in which to identify the different support and resistance levels and highlight how to be consistent in your chosen approach.
How to Identify Support and Resistance Levels
There are several ways you can identify support and resistance levels. Below are the most popular and in turn the most reliable methods to pinpoint a level.
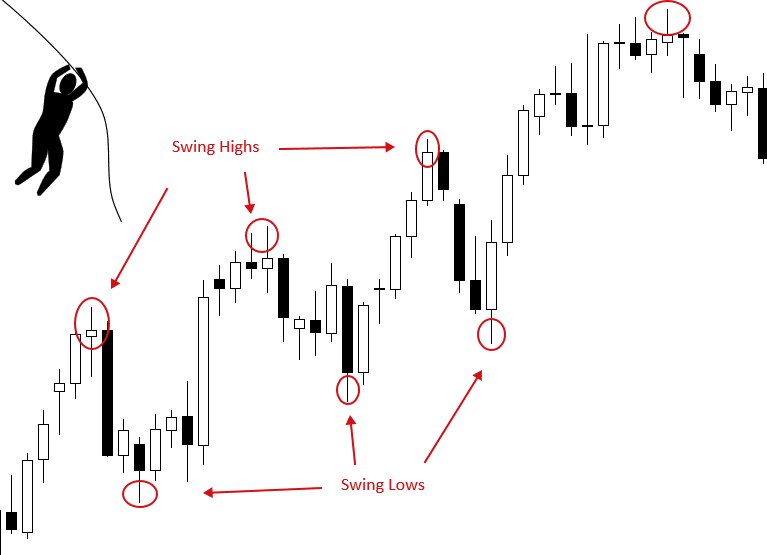
- Price swing highs and lows — Significant previous lows and highs where the market has either gone down to a level and rebounded or up to a level and setback. These are seen as important support and resistance lines.
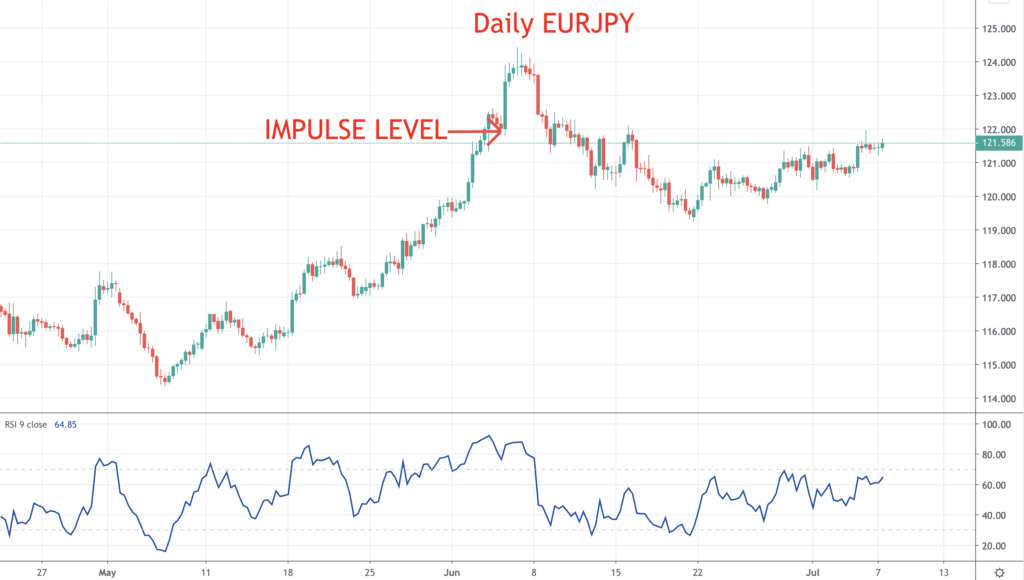
- Impulse levels — If the market has impulsively accelerated from a price point, then that price level is seen as a notable level of support or resistance.
- Round numbers — Round numbers, such as 12,000, or 1.1000 are often viewed as important support and resistance levels. That is for two reasons:
- Psychological — Many traders and investors place buy or sell orders and stop losses and take-profit targets at round numbers. That is for ease and for psychological reasons. This can lead to a build-up of orders, therefore, supply or demand at round numbers making the levels notable supports or resistances.
- Option strikes — Options are a derivative product. We will not explore them here, suffice to say that options have ‘strike prices’, which are round numbers. This is another factor contributing towards round numbers as being notable support and resistances.
Whilst the above are considered the simple ways to identify support and resistance, below are some other ways that can also be used. Trend lines and Channels — Trend lines and channels are used to identify markets that are trending. The market price will tend to try to defend trend lines and channels, where they then act as a support or resistance level. But if the trend lines or channels break, then there is often an acceleration through them as support or resistance. We look at trend lines and channels in more depth here.
Pattern lines — We explore pattern lines in detail here. But price patterns usually have key static levels or dynamic lines that act as support or resistance.
Moving Averages – These dynamic lines are often used as support or resistance.
Fibonacci retracements and extensions — Fibonacci retracements and extensions can be calculated from the Golden Ratio and the horizontal price lines used as support or resistance levels. We review Fibonacci retracements and extensions in more depth here.
Bollinger Bands — A more sophisticated way of using moving averages with standard deviation bands, developed by John Bollinger. They can be used as dynamic support and resistance.
Pivot Points – We delve into the details of Pivot Points below and reveal more about technical analysis here.
How are Support and Resistance Used In Trading?
Support and resistance are used in trading in two main ways.
- To be able to identify if the market is in a range environment, consolidation, or is trending up or down.
- To identify levels around which a strategy can be formed — where to enter trades, exit trades for profit, or to place stop losses.
We look at support and resistance trading in more depth below in the section ‘Support and Resistance Strategy’.
How do you Calculate Support and Resistance?
Support and resistance are calculated by various methods depending on the support and resistance levels you are studying. It might be easy just to simply identify significant price highs and price lows on the chart. When it comes to more complicated support and resistance levels that need to be calculated, most modern trading platforms, such as MT4, automatically calculate the support and resistance levels. Pivot Points are a type of support and resistance that are commonly used in short-term, day trading and are calculated automatically.
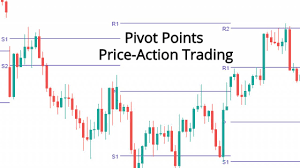
What Is Pivot Point Trading?
Pivot Points trading is a system using the Pivot Points, which are derived from relatively simple calculations based upon the high, low and closing prices from the previous trading day. The pivot point system was originally used by pit traders and are a good way to be consistent with levels. From the Pivot Points calculations, a series of support and resistance levels are identified, and a trading strategy can be built around the recognised levels.
The calculation for pivot points is as follows, where High, Low and Close are all from the prior trading day.
Pivot Point (PP) = (High + Low + Close)/ 3
Resistance 1= (PP × 2) − Low
Resistance 2= PP + (High−Low)
Support 1 = (PP × 2) − High
Support 2= PP−(High−Low)
Most modern trading platforms (such as MT4,) calculate the Pivot Points and Pivot Point Supports and Resistances. These Pivot Point Supports and Resistances can then be used as levels to form part of a Pivot Point trading strategy.
A popular day trading strategy when using Pivot Point Supports and Resistances is to decide to buy or sell the market based on the early price moves in the day.
- If the price moves above the Pivot Point (PP) in early trading towards the first resistance level, Resistance 1, this would be a buy signal.
- The differing Pivot Point Supports and Resistances can then be used as targets and stop losses.
- If the markets moves below the Pivot Point (PP) in early trading, the trader may decide to short.
That is not the only way that Pivot Point Supports and Resistances can be used for a Pivot Point trading strategy — they may simply be used as ordinary support and resistances in a strategy, looking for clusters, where the Pivot Point Supports and Resistances are close to other notable support and resistances from other sources.
How To Draw Support and Resistance Lines
Support and resistance lines will be drawn on charts in different ways, depending on how the support and resistance levels are identified. If they are previous highs or lows, impulse levels, pivot points or Fibonacci levels, then they will be static, horizontal price levels that do not change as support or resistance.
If we are looking, for example, at trend lines, channels or moving averages as support and resistance though, these levels are not static, they are dynamic, changing with the price and with time. So, these support and resistance levels have to be monitored more closely, as they are by definition, changing with time and or price.
Support and Resistance Strategy
There are various ways of using support and resistance levels to build a trading strategy. Initially, the analyst or trader must identify the support and resistance levels they think most important, or maybe to combine different support and resistance indicators to discover zones or clusters of support and resistance.
- Once the areas of support and resistance are identified, the strategy should be to use them to enter and exit trades.
- If the market is in a ranging environment, look to try to sell at the upper end of the range, at resistance levels or zones. Look to buy at the bottom end of the range in the area of support levels.
- If the market is in a trend it you should look to trade in the direction of the trend. For example, if the market is in an uptrend, look to buy dips towards or near to support levels or zones. Or wait for resistance areas or levels to be overcome in the uptrend and then enter long positions on the break above resistance.
- In a downtrend, identify resistance levels and look for sell opportunities if the price corrects up towards resistance. Or if the downtrend breaks below support, then to enter short positions once the support is surrendered.
For more information on your technical analysis journey check out our article on chart patterns.
