Charts patterns are formed on differing markets and asset classes when trends take a pause and go into a consolidation stage. Chart patterns are a way for you to be able to decide if the price is going to continue in the same direction as the underlying trend after the consolidation phase has ended, OR if the trend is going to reverse direction. Also, you’d be able to predict the possible target for the next move from the pattern.
How Many Types of Chart Patterns Are There?
There are many types of chart patterns:
- Head and shoulders
- Double top
- Double bottom
- Rounding bottom
- Cup and handle
- Wedges
- Pennant or flags
- Ascending triangle
- Descending triangle
- Symmetrical triangle
- Triple Top
- Harmonic
There is another completely separate set of charts patterns too that you need to know, Candlesticks.
What Chart Pattern Group do These Fall Into?
Chart patterns fall into three groups; reversal patterns, continuation patterns and bilateral chart patterns, as looked at in Part 1.
| Chart Pattern Name | Chart Pattern Group |
| Head and shoulders | Reversal |
| Double top | Reversal |
| Double bottom | Reversal |
| Rounding bottom | Reversal |
| Cup and handle | Reversal |
| Wedges | Reversal or Continuation (Bilateral) |
| Pennant or flags | Continuation |
| Ascending triangle | Continuation |
| Descending triangle | Continuation |
| Symmetrical triangle | Reversal or Continuation (Bilateral) |
| Triple Top | Reversal |
| Triple Bottom | Reversal |
| Harmonic | Reversal |
| Candlesticks | Reversal or Continuation (Bilateral) |
Reversal patterns, like a Double Top indicate the likely end of an up trend and a probable move lower in price. Conversely, a Triple Bottom forms in a down trend and indicates a reversal higher, for a possible up move.
With continuation patterns, such as the pennants or flags, you’d expect the price to continue in the direction of the original trend. This comes after the pattern has signaled the consolidation stage has ended.
Bilateral patterns, can either signal reversals or continuations, depending on how the pattern is formed and how the price breaks out from the pattern.
What are the Most Commonly Used Chart Patterns?
The most commonly used charts patterns are; Head and Shoulder Pattern, Double Top & Double Bottom Patterns, Triple Top & Triple Bottom Patterns, Rounding Bottom Pattern, Wedge Pattern, Pennant or Flag Patterns Ascending & Descending Triangle Patterns and in their own category Candlestick Patterns.
We’d recommend that you become familiar and learn to spot these pattens to improve you trading.
Head and Shoulders Patterns
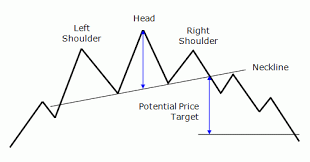
There are two types of Head & Shoulders patterns; the Head & Shoulders Top and the Inverse Head & Shoulders.
Head & Shoulders Top: This pattern develops at the top of an up trend.
- The market is in an up trend of higher highs and higher lows.
- The market pulls back lower after the Head to then post a lower high, below the peak of the Head, which defines the second Shoulder.
- Between the two lows either side of the high that is the Head we then draw a line, across the bottom of the Head, which is known as the “neckline”.
- If, after the second Shoulder, the market breaks below the “neckline”, the Head & Shoulders top is confirmed.
- The target for the potential price move lower or Minimum Price Objective (MPO) is the vertical distance from the top of the Head down to the “neckline”. This distance is projected down from the point where price breaks the “neckline”.
- Sometimes you’d see a rebound back higher to test the “neckline”, which is called the “return move”.
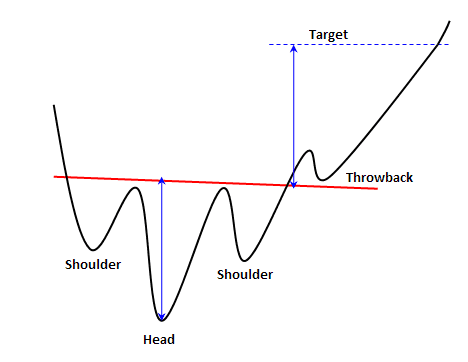
Inverse Head & Shoulders: The Inverse Head & Shoulders is the upside down version of the Head & Shoulders pattern. It occurs at the bottom of a down trend. When the pattern is triggered through the “neckline”, the MPO is projected higher.
Double Top & Double Bottom Patterns
Double Top: When you look for a Double Top, you need to at first identify an up trend.
- The price makes a high and pulls back lower
- A rebound then sees another high, at or close to the most recent, highest high.
- The price then falls back lower again, and if it break below the low between the two highs, a Double Top is completed.
- The target for the potential price move lower (MPO) is the vertical distance from the Double Top peaks down to the low between the two highs, then projected lower from the low.
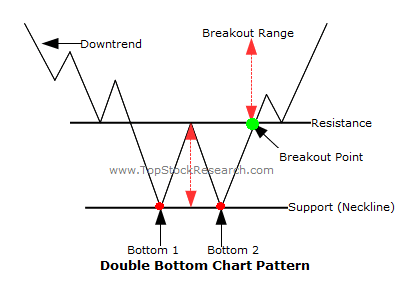
Double Bottom: The Double Bottom is the inverse of the Double Top. The market is in a down trend, then puts in two lows around the same price. If the market breaks above the high between the two lows, a Double Bottom is confirmed.
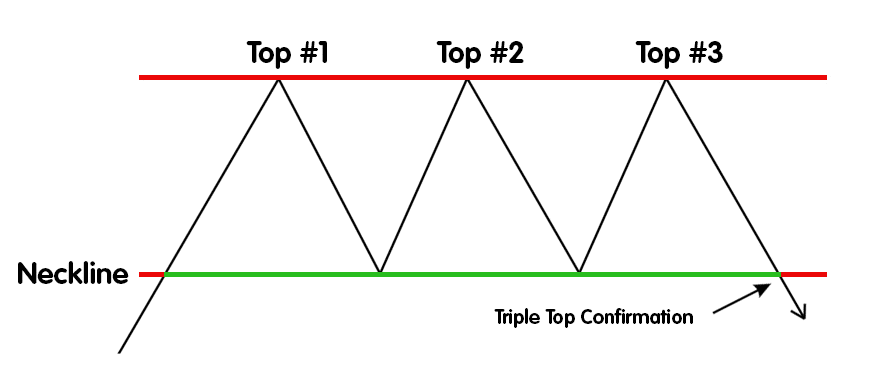
Triple Top & Triple Bottom Patterns
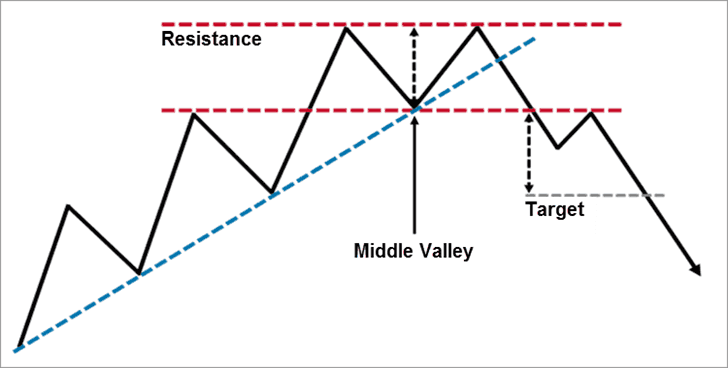
Triple Top: The Triple Top is effectively the same as the Double Top, but with three highs around the same level. The pattern is completed when price breaks below the lowest low between the three peaks.
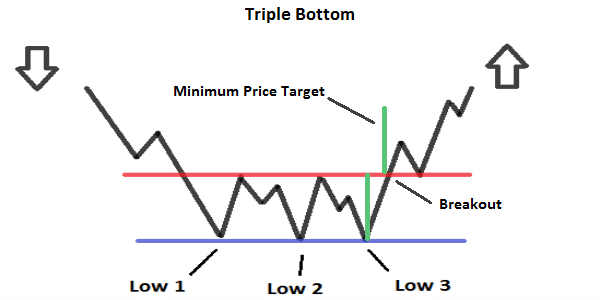
Triple Bottom: The Triple Bottom is the opposite of the Triple Top and similar to the Double Bottom, with three lows around the same level. The pattern is completed when price breaks above the highest high between the three lows.
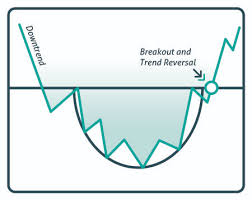
Rounding Bottom Pattern
A rounding bottom is found at the end of a down trend and is identified by a series of lows that form a “U” shape. Rounding bottoms are usually seen at the end of longer-term down trends and signal a longer-term price reversal.
Wedge Patterns
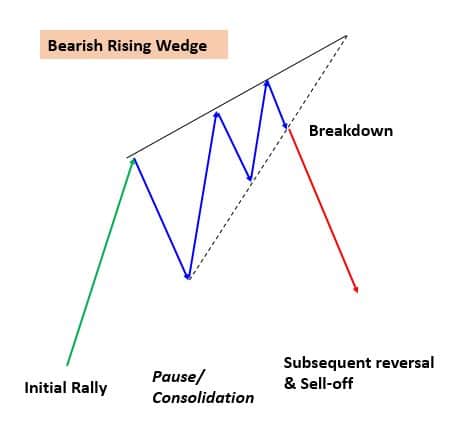
Rising Wedge (as continuation pattern): A Rising Wedge occurs when the market is moving higher, but the higher lows are moving up at a steeper angle than the higher highs, to form Rising Wedge pattern. The expectation for the pattern is that the market will then break below the lower up trend line, signaling a move lower. If the market was previously in a down trend, this would be a continuation pattern.
Rising Wedge (as reversal pattern): The Rising Wedge pattern is the same but occurs in an up trend. The Rising Wedge pattern signals a likely move lower on the break of the pattern, which would then be a reversal of the up trend.
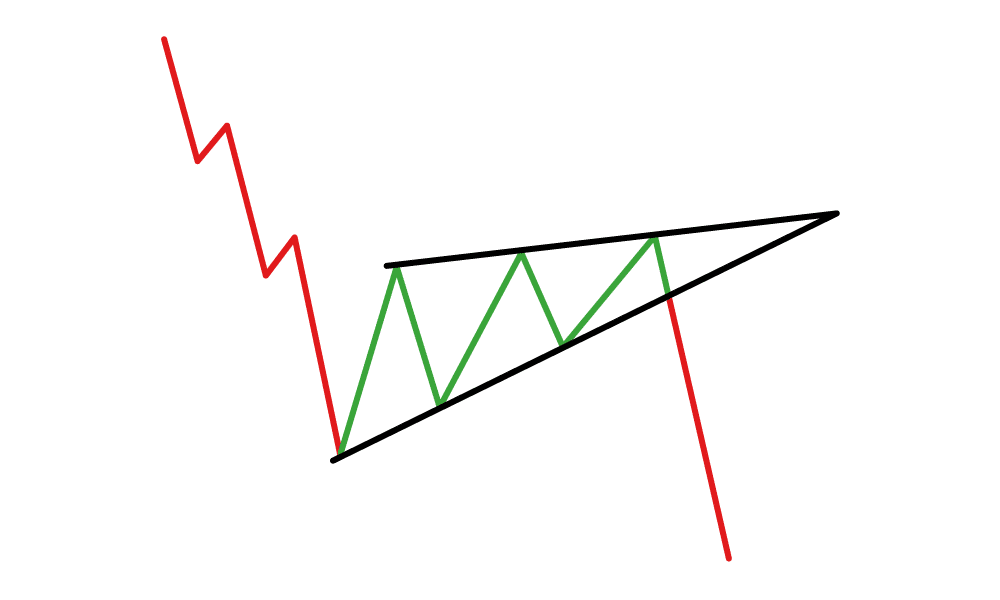
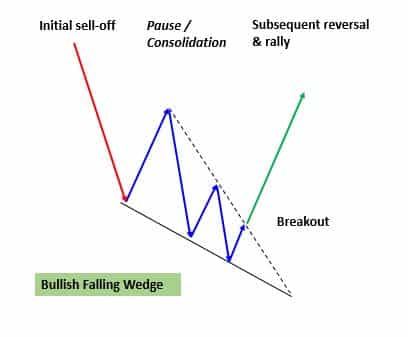
Falling Wedge (as continuation pattern): A Falling Wedge is the opposite to the Rising Wedge pattern. It is seen when the market is moving lower, with the lower highs moving down at a steeper angle than the lower lows. The expectation for the Falling Wedge pattern is that the market will push above the steeper, down trend line, signaling a move higher. If the market was previously in a up trend, this would be a continuation pattern.
Falling Wedge (as reversal pattern): This is the same as the above Falling Wedge pattern but occurs in a down trend. The Falling Wedge pattern signals a likely move higher on the break of the pattern, which would then be a reversal of the down trend.
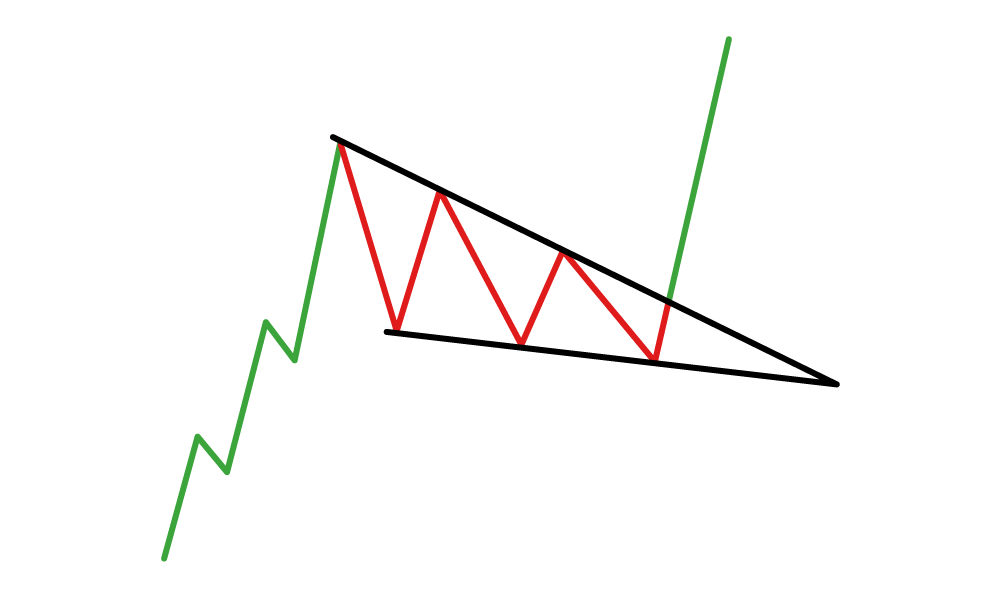
Pennant or Flag Patterns
- The Pennant and Flag patterns are continuation patterns and most common and reliable on short-term charts.
- They occur when price accelerates higher or lower, almost vertically.
- This accelerated move makes up the “flagpole”.
- Then price goes into a consolidation phase, where very little of the previous accelerated move is surrendered.
- The shape of the consolidation pattern is described as a Flag if it a rectangle contained by two parallel line either sideways of against the initial accelerated move.
- It is a Pennant if it is shaped like a triangle.
- If price breaks from the Pennant or Flag pattern in the same direction as the original accelerated move, then the MPO is the height of the flagpole projected higher or lower.
Ascending & Descending Triangle Patterns
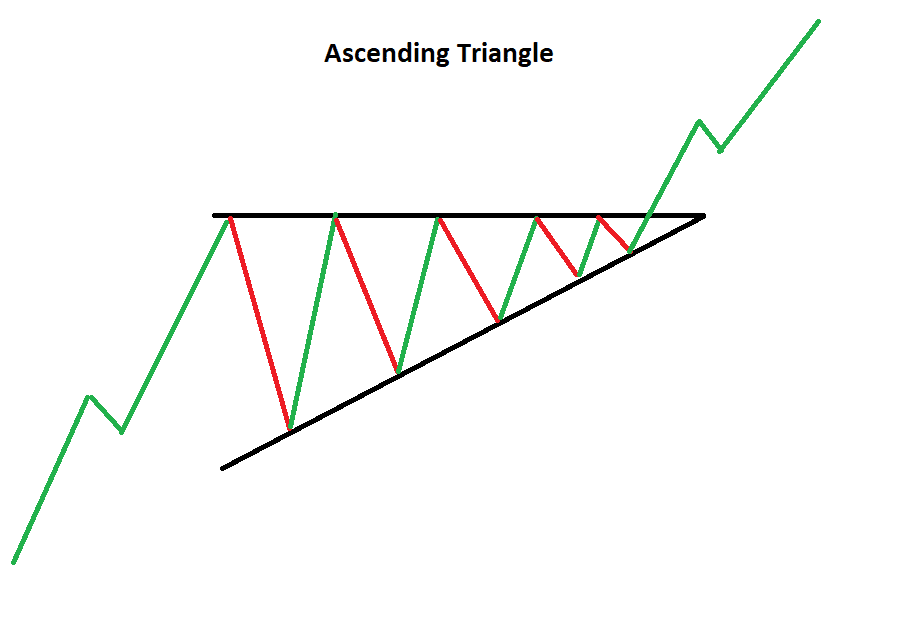
Ascending Triangle
- This pattern usually occurs in an up trend after the price goes into consolidation.
- The consolidation phase is characterized by a Triangle with ascending lows, but highs around the same price.
- The expectation is for the consolidation to resolve higher, above the highs.
- The MPO is then measured as the widest point of the Ascending Triangle (the base of the triangle), projected up from the highs of the triangle.
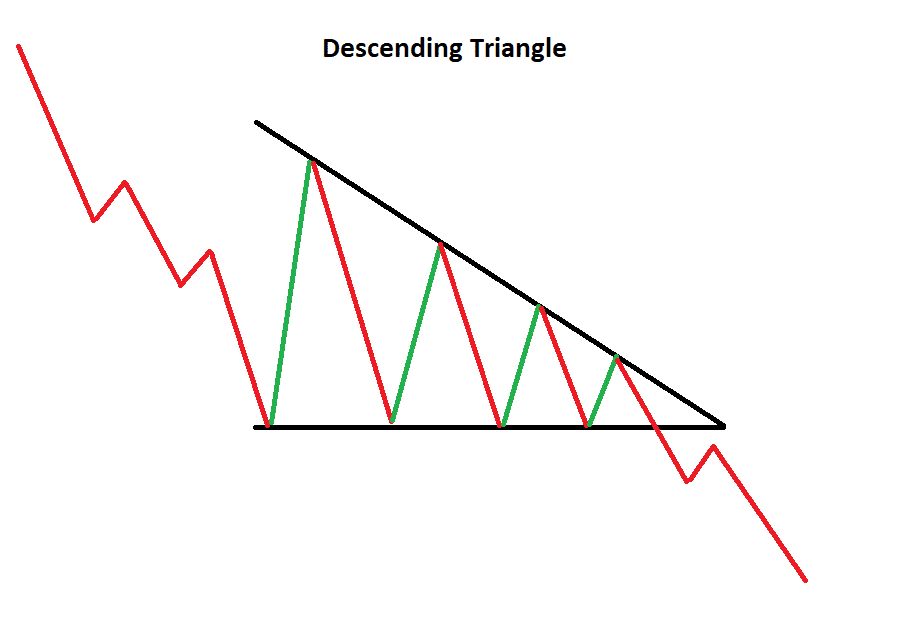
Descending Triangle: This pattern is effectively the opposite of the Ascending Triangle. When price break below the bottom of the Descending Triangle support line, a continuation of the down trend is signaled. The MPO is calculated as with the Ascending Triangle.
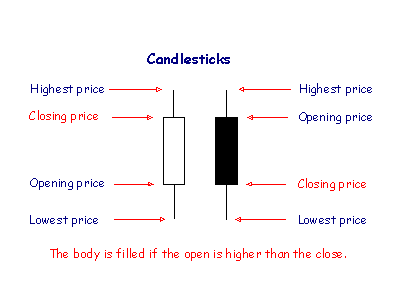
Candlestick Patterns
Candlestick patterns are a very important subcategory of charts patterns, that we look at in more detail here. Candlestick patterns were developed in 18th century Japan by Munehisa Homma, an incredibly successful rice merchant and trader. The patterns are based on combinations of candlestick price charts that Homma identified and are able to predict potential price changes. Most candlestick patterns are reversal patterns (though some are continuation patterns).
We have looked at the most popular chart patterns here and shown you how to identify these different patterns. You should be able to decide on the likely direction of the market and calculate price targets from the patterns.
