The Market Chartist
Since launching back in 2012, the Market Chartist technical analysis reports have established a strong global, institutional client base. Clients include global investment banks, institutional brokers, research boutiques, hedge funds, high net worth individuals, plus professional traders and investors.
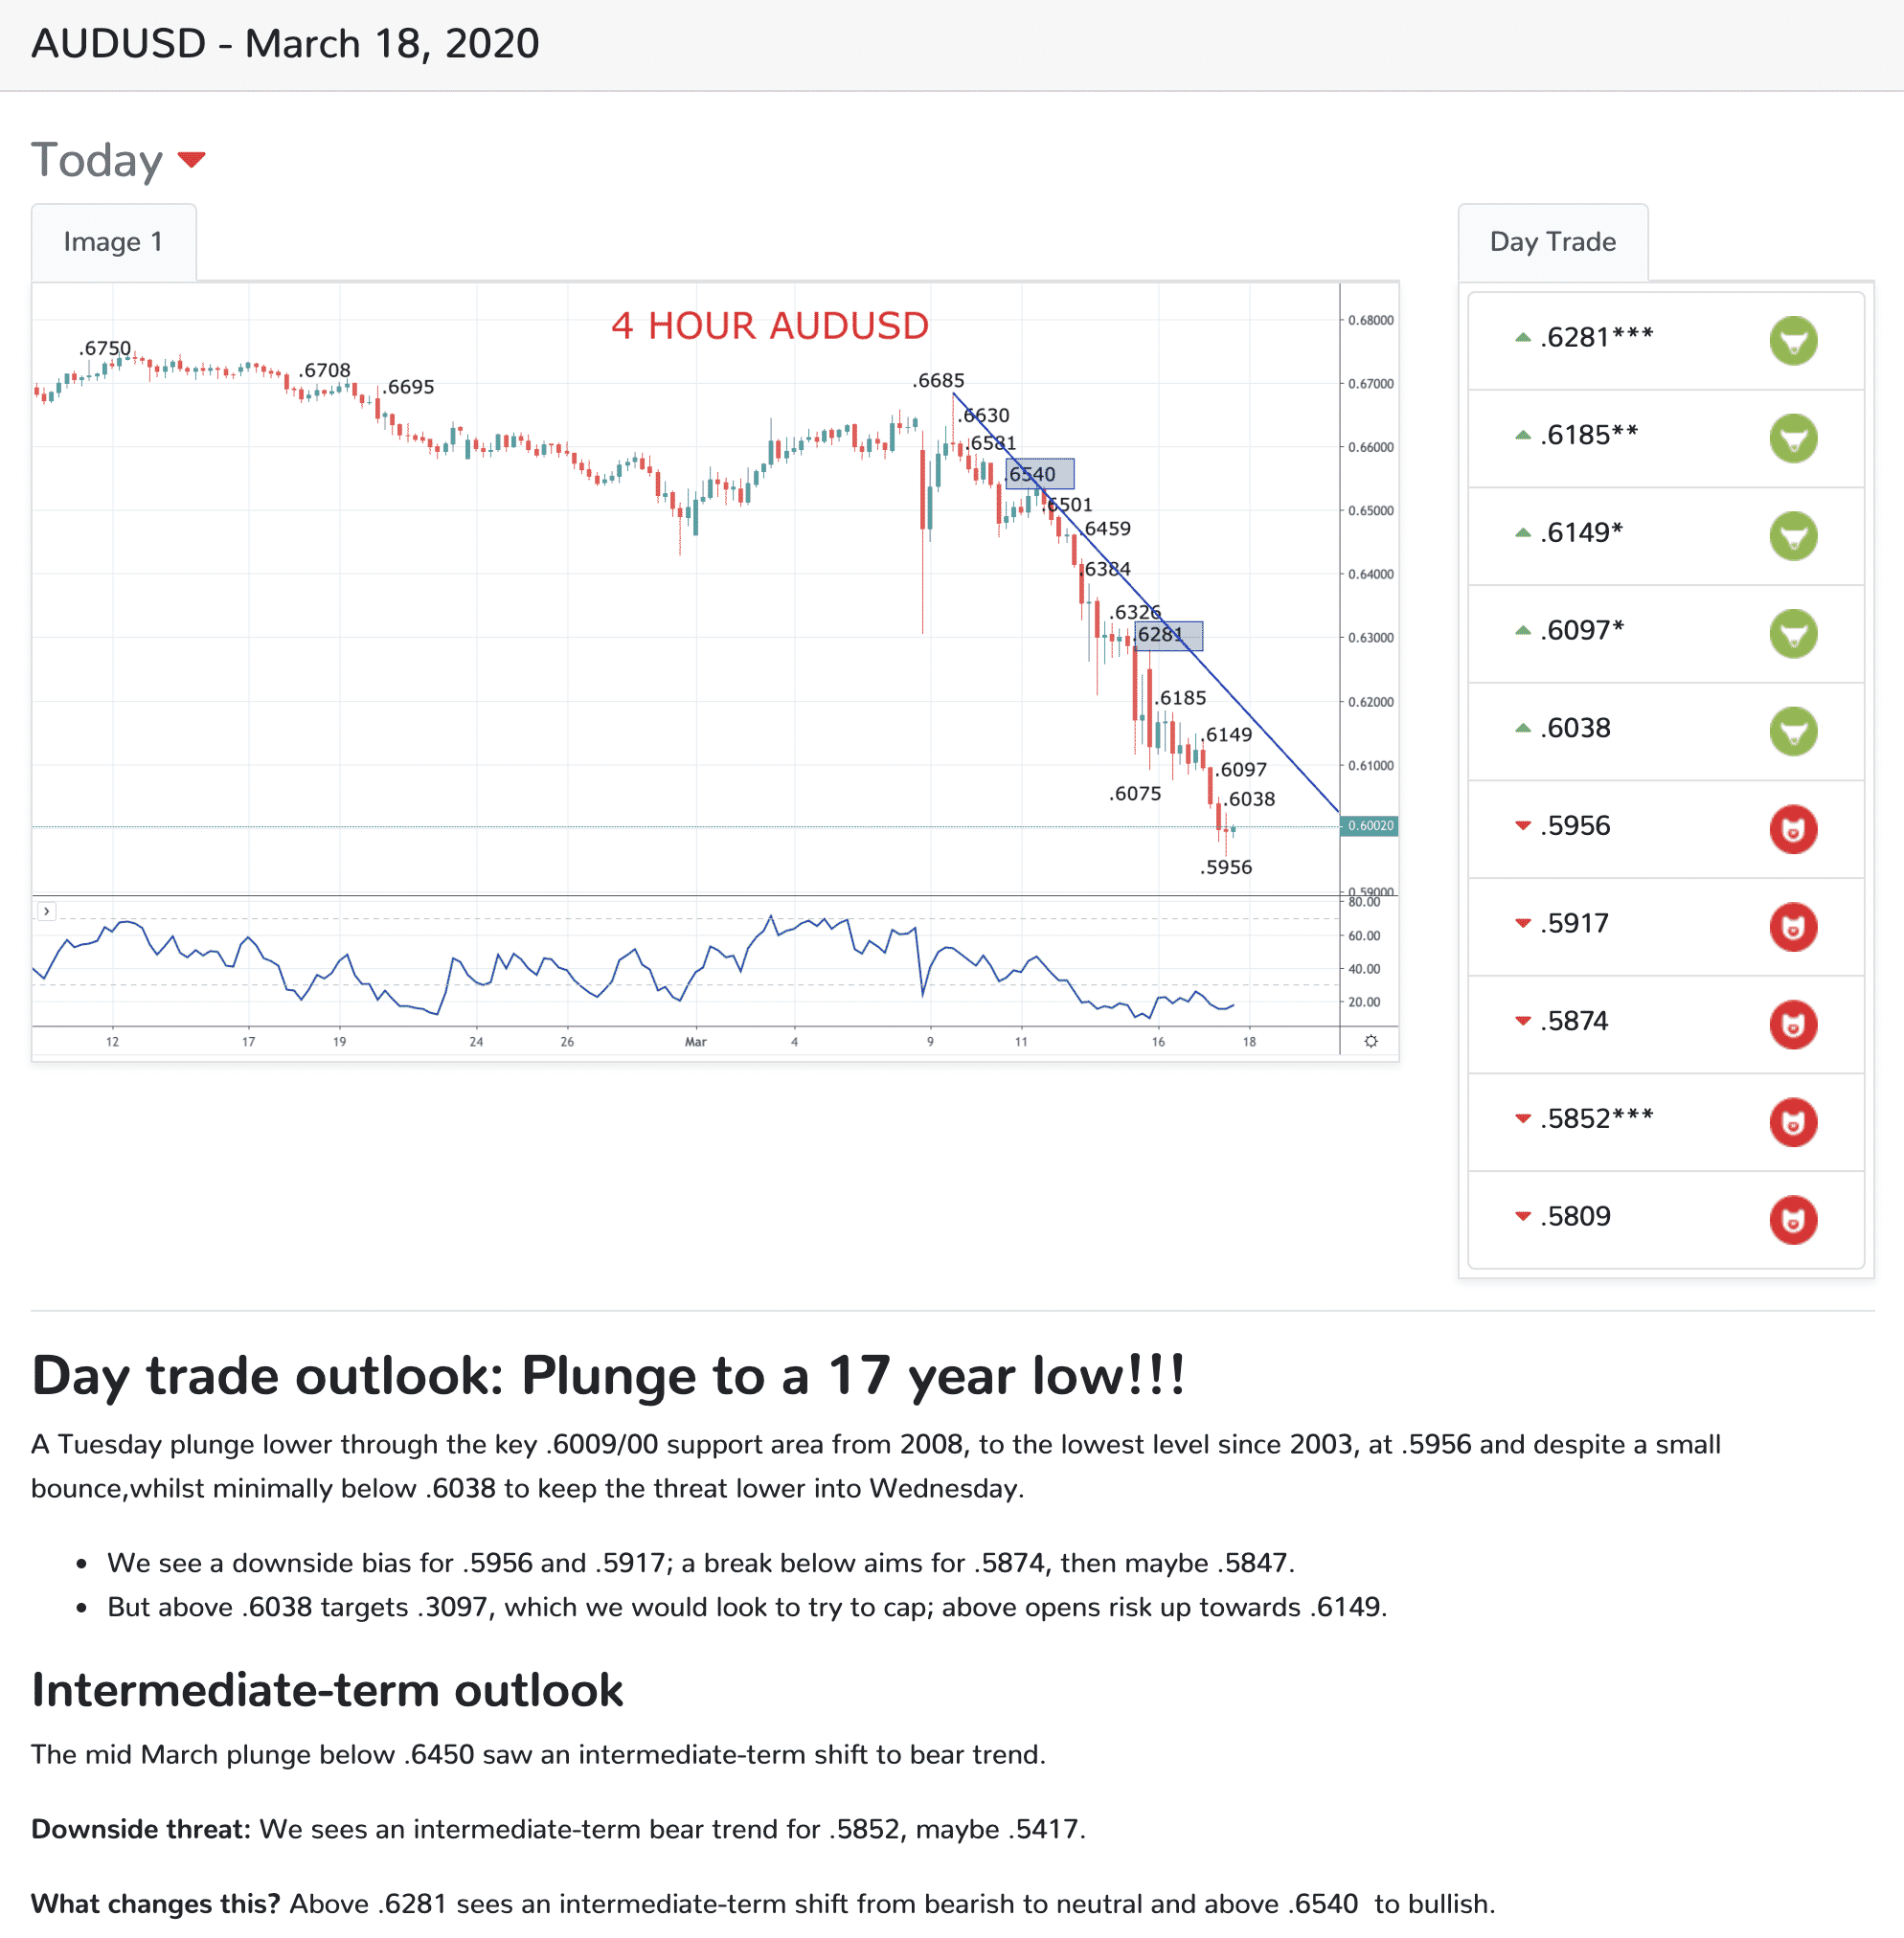
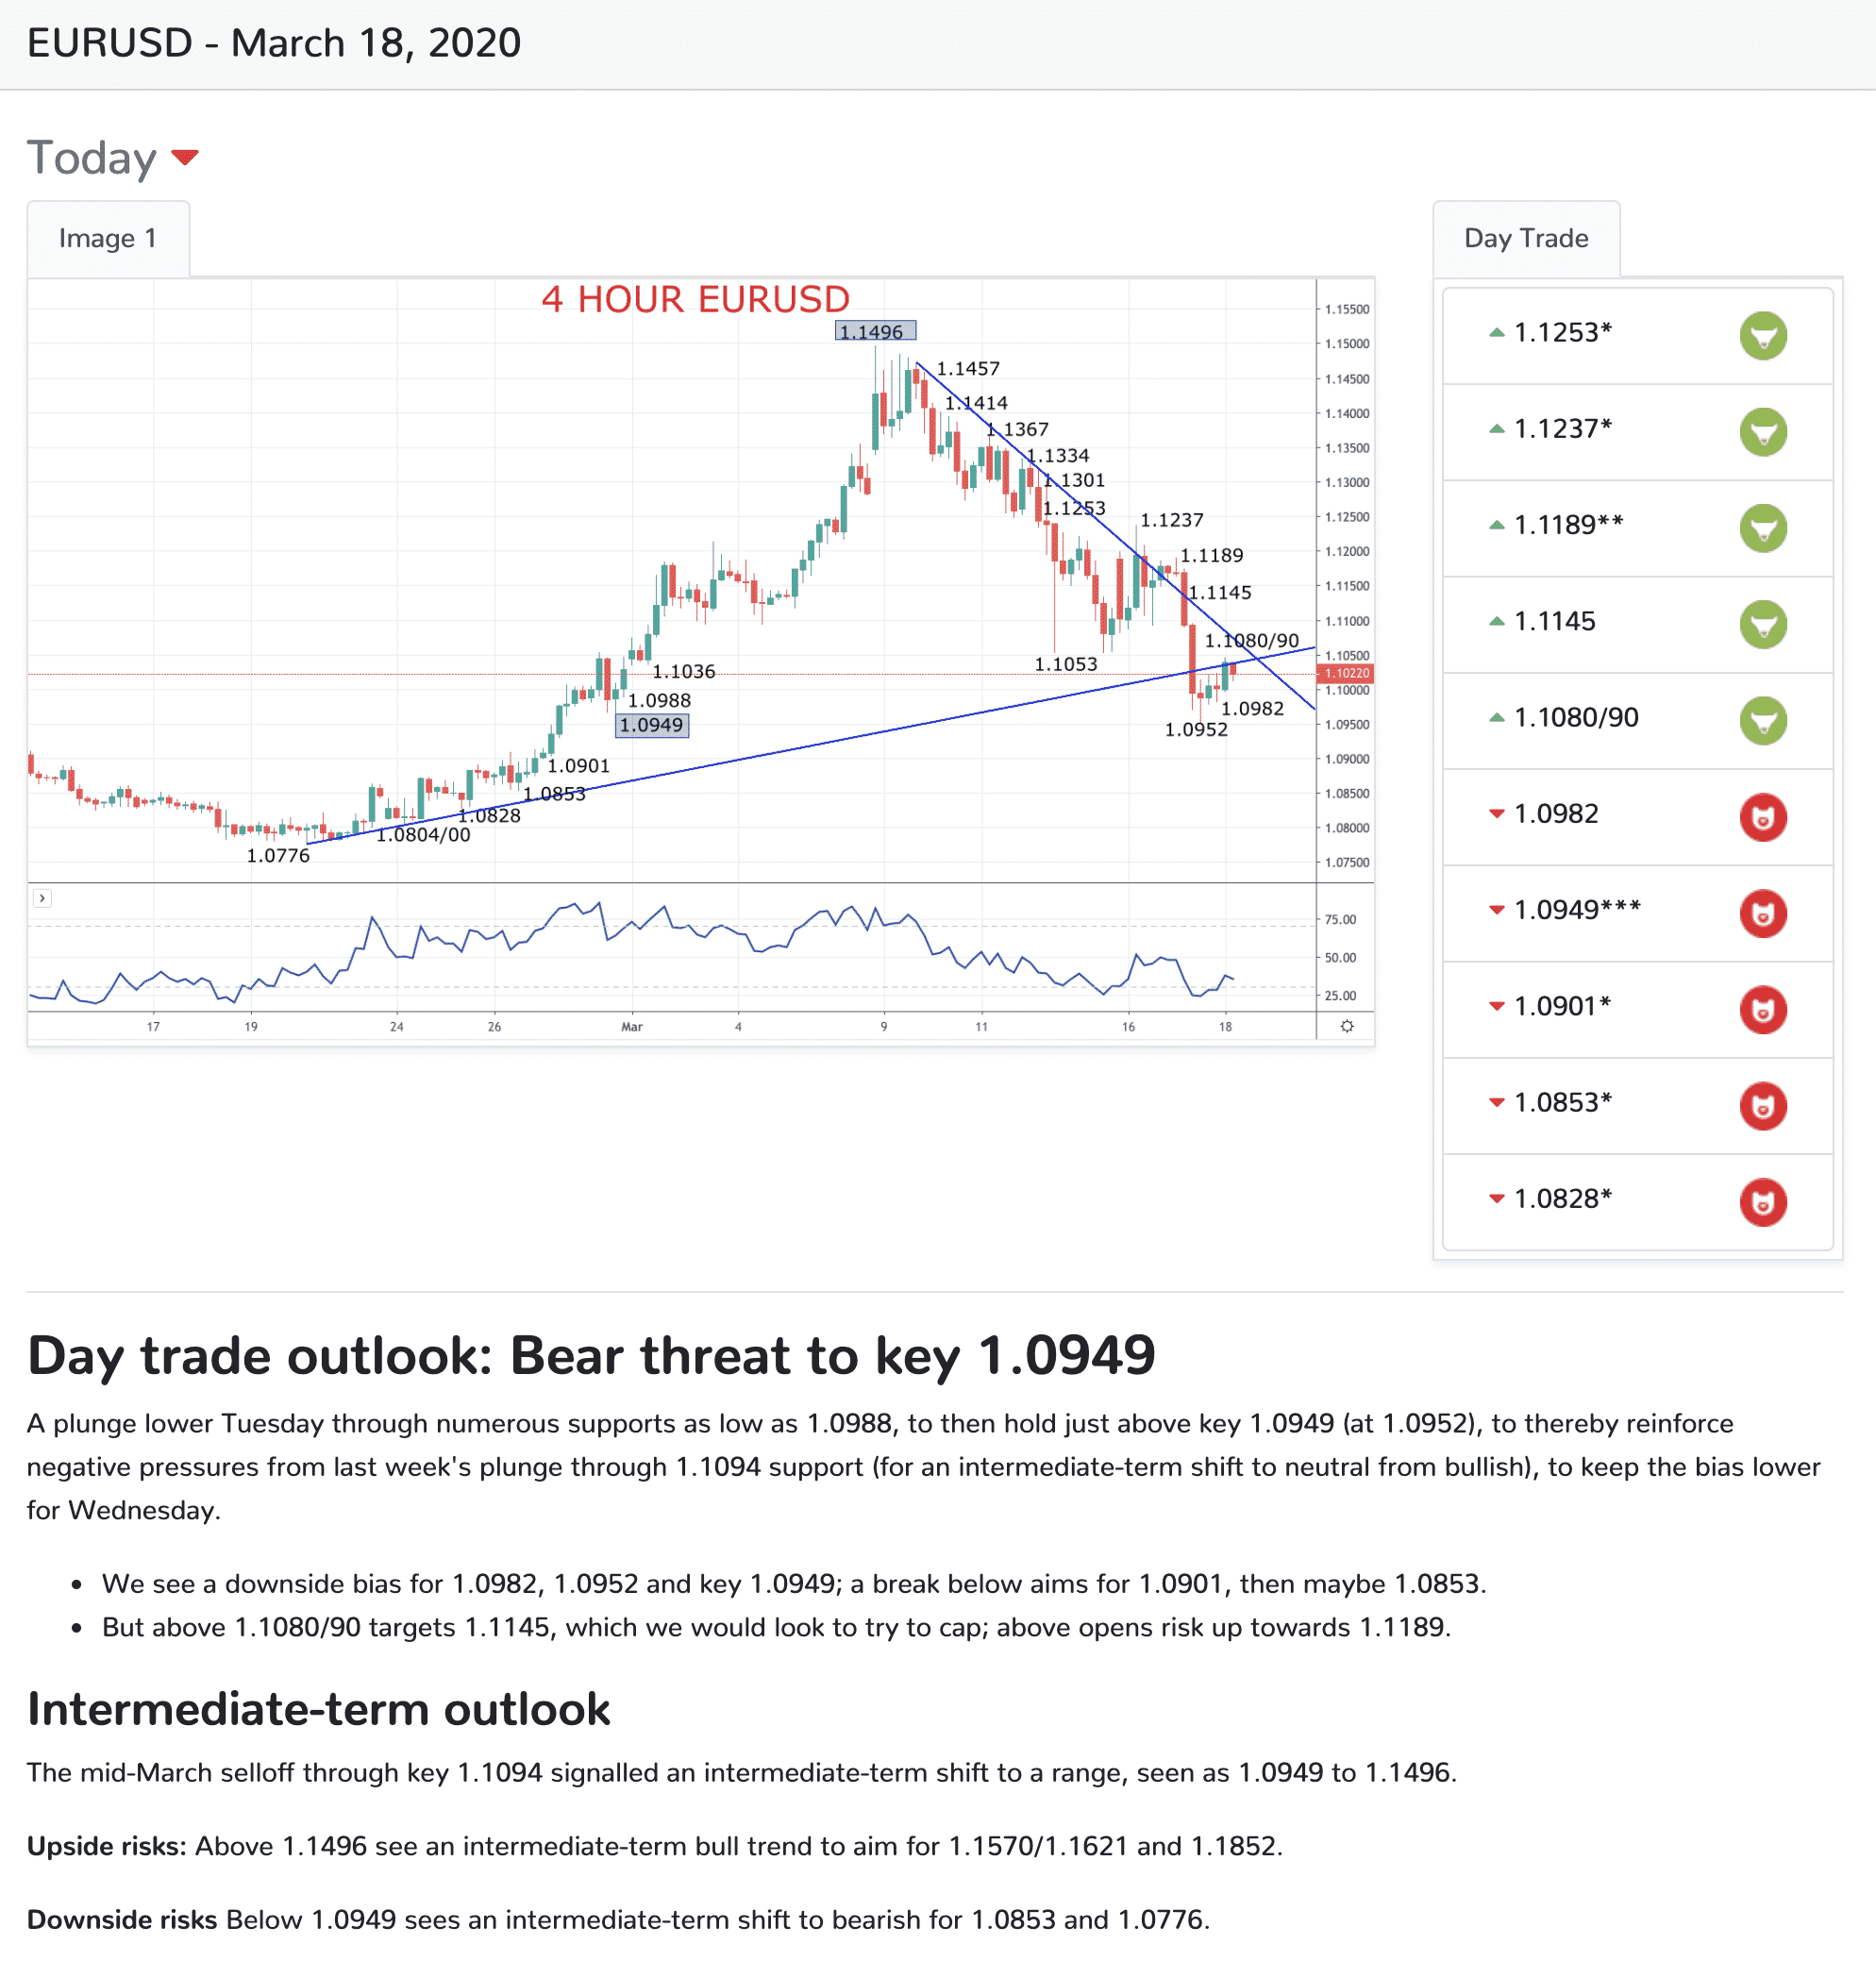
Example reports:
Our client list includes:
- Morgan Stanley
- Merrill Lynch/ Bank of America
- J P Morgan
- Westpac
- Toronto Dominion (TD) Securities
- Glencore
- Kylin Prime Capital
- In Touch Capital Markets
- GFI Group
- Griffin Markets
- Marex Spectron
- Vantage Capital Markets HK
- Hantec Markets
- Constellation, an Exelon Company
- Plus, numerous others we prefer not to name ….
But now you too can benefit!
Sign up now for your 7 day free trial
The multi-award-winning Market Chartist is now branching out to offer all professional traders the opportunity to share in the benefit of our research.

As “The Market Chartist”, Steve Miley has won many awards from the Technical Analyst Magazine.
He was the 2016 & 2013 Winner (plus 2014 Runner Up) for Best Independent Fixed Income Research & Strategy and winner of Best FX Research & Strategy in 2012. He was also a finalist in the Technical Analyst of the Year category each year for 2012-2018.
With 10 daily reports covering 6 Forex markets and 4 stock indices, we allow our clients to benefit from the day trade opportunities for the next few hours and through the day, but also offer the intermediate/ swing trader a view for the coming 1-2 weeks.
About Market Chartist
Steve Miley is The Market Chartist and has three decades of financial market experience. He spent 2009-2012 as a Director of the FX Technical Analysis Research Strategy team at Credit Suisse and was previously at Merrill Lynch for 15 years; 10 years as a technical analyst, 5 years in Fixed Income sales.
He was 2013 winner of the Technical Analyst Magazine Award for Best Independent Fixed Income Research & Strategy, Runner Up for the same award in 2014 and was the winner of Best FX Research & Strategy 2012 (at Credit Suisse).
Steve is also the Editor-in-Chief for FXExplained.co.uk, the Academic Dean for The London School of Wealth Management, plus Senior Investment Advisor at Kylin Prime Capital.
Steve is a Member of the Society of Technical Analysts (MSTA) and holds a Master’s degree in Politics, Philosophy & Economics from Lincoln College, Oxford University.
As an analyst, Steve has covered all major asset classes including Rates & Credit, G10 & EM currencies, Equity Indices & Sectors and Commodities and has strong relationships across the institutional financial trading spectrum, including Central Banks, Investment Banks, Hedge Funds and Global Corporates.
More about the Market Chartist reports
As a trader, can you afford to be without the multi award winning Market Chartist reports to assist you in your day trade and short-term trading? We think not!
Get access to the reports used by the professional, financial market community. Try our reports today and see your trading improve. You can see an example of a recent report here.
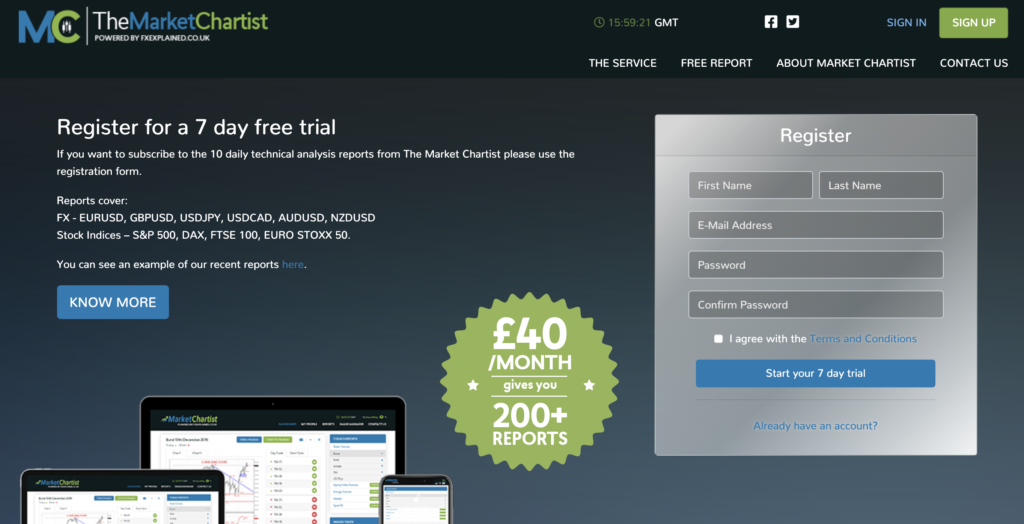
Register for a free trial
First you will need to register here and start your 7-day free trial. This will give you access to the 10 reports every day for a week. This is how the registration works.
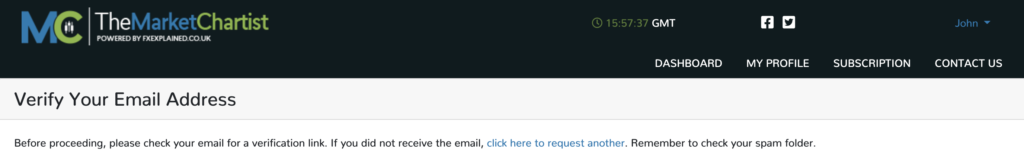
You will need to verify your email address, see below:
Then you need to input your credit card details.
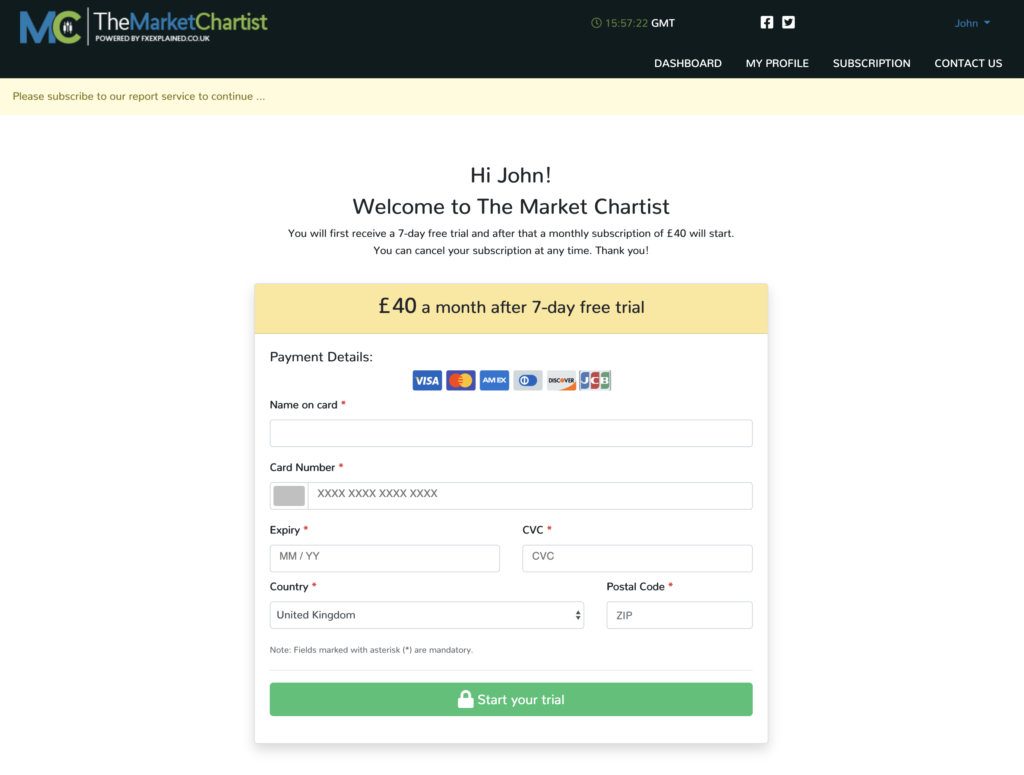
Then you will be able to access the reports for 7 days for free. After that a monthly subscription of £40 will start. If you would like to cancel your subscription before the 7 days are up, you simply login and and hit the subscription link at the top and then hit the cancel subscription button.
Two daily email alerts
You will receive two email alerts each day when new reports are available. These will tend to be between 16:00 and 20:00 GMT for the Asian Pacific Forex reports; AUDUSD, NZDUSD and USDJPY. Then, between 06:00 and 07:00 GMT another email alert will be sent to confirm the release of the other reports; EURUSD, GBPUSD, USDCAD in the Forex space and Euro STOXX 50, FTSE 100, DAX and S&P 500 for the equity indices.
The Dashboard
Once logged in, you will move to the dashboard page, with access to today’s reports AND prior reports.
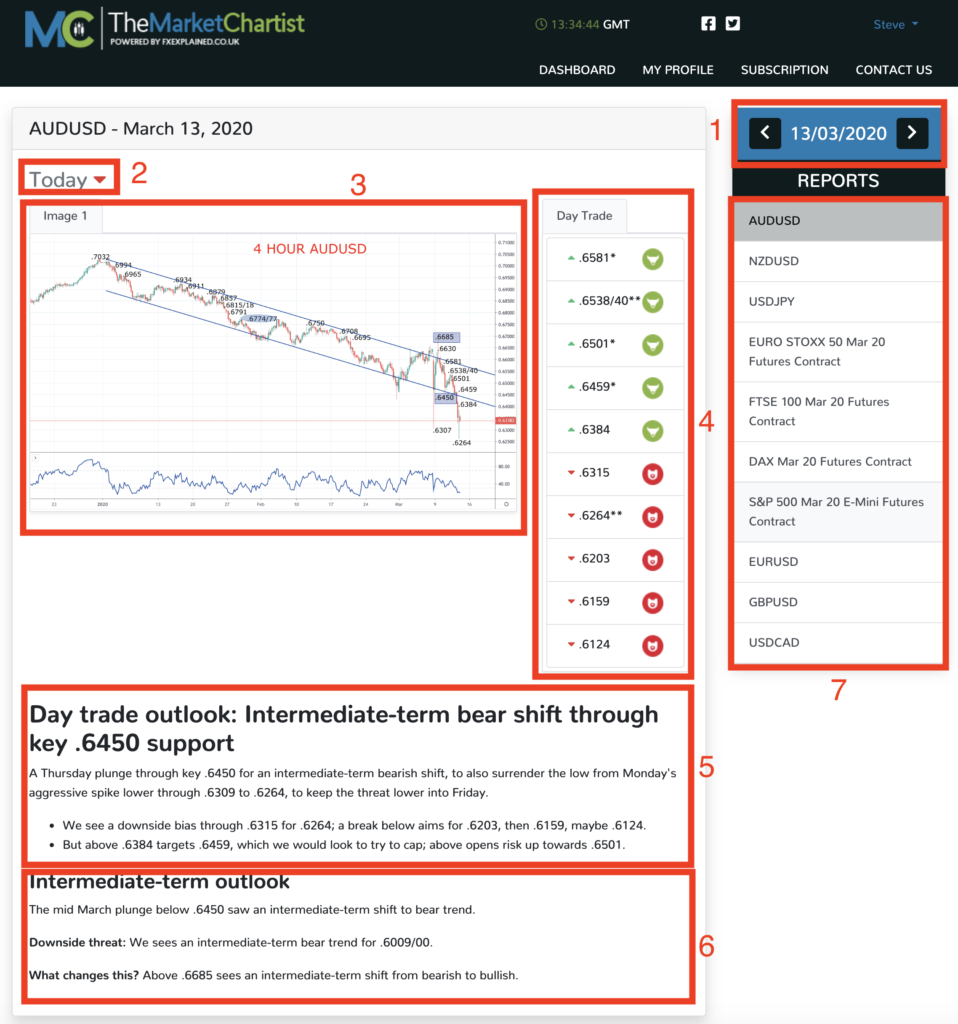
Let’s now run through the various elements of the dashboard:
- The reports date: Here you can scroll back through past reports, see how well we predicted the market previously, or for you to see how the view has shifted over time.
- The daily view: A red down arrow for a negative, bearish view for the day, a green up arrow for a positive, bullish view for the day.
- The chart: Displaying the technical analysis, the levels that are important for the day, what is momentum doing.
- The support and resistance levels: Support below the market when published, the red bears; resistance above the market when published, the green bulls. These are marked with between 0 and 3 * to denote the importance of the level, the more *s the more significant the level as support or resistance.
- The commentary 1: The daily update, what has happened since the last report, what is the impact on the daily view, what are the directional risks for the day, with the levels to monitor.
- The commentary 2: The intermediate-term outlook. Where is the market directional bias for the next 1-2 weeks, what are the target levels and what changes this view?
- The report selector: Switch between different reports.
Register here
If you want to subscribe to the 10 daily technical analysis reports from Market Chartist please register and enter your payment details. You will first receive a 7-day free trial and after that a monthly subscription of £40 will start.
You can cancel your subscription at any time by logging in to your account and clicking on subscription in the top menu. Click the cancel subscription button. You can at anytime restart your subscription by logging in and entering your credit card credentials again.
Sign up now for your 7 day free trial