In this Master Academy educational video and article, we are looking at an Introduction to Technical Analysis, elaborating on the brief introduction we had in our article Fundamental vs. Technical Analysis.
In this article we will look at:
- What Technical Analysis is, the Principles of Technical Analysis
- Chart types
- Time Frames
Principles of Technical Analysis
Technical Analysis is the use of charts to make trading/investing decisions based on the Principles of Technical Analysis.
Here is a definition from John J. Murphy from his book, Technical Analysis of the Financial Markets
“Technical analysis is the study of market action, primarily through the use of charts, for the purpose of forecasting future price trends. The term “market action” includes the three principal sources of information available to the technician—price, volume, and open interest.”
The three core Principles of Technical Analysis area:
1. The Price discounts everything
Technical Analysts understand that anything that can impact the market price is already reflected in the price. This would include:
- Fundamentals including all data
- Geopolitical risks
- Central Bank expectations
- Market psychology/ investor behaviour
2. Price moves in trends
- Accepting the concept of trend is critical
- By recognising early stage, directional trends traders are above to trade in the direction of that trend
3. History repeats itself
- Chart patterns echo market positioning and trader/ investor psychology and behaviours.
- Human psychology tends not to change over time
- Previous price patterns and trends are liable to recur now and in the future
Chart Types
There are three main chart types, but also others we will highlight.
- Line Chart
- Bar Chart (or OHLC)
- Candlestick Chart
- Other Chart Types
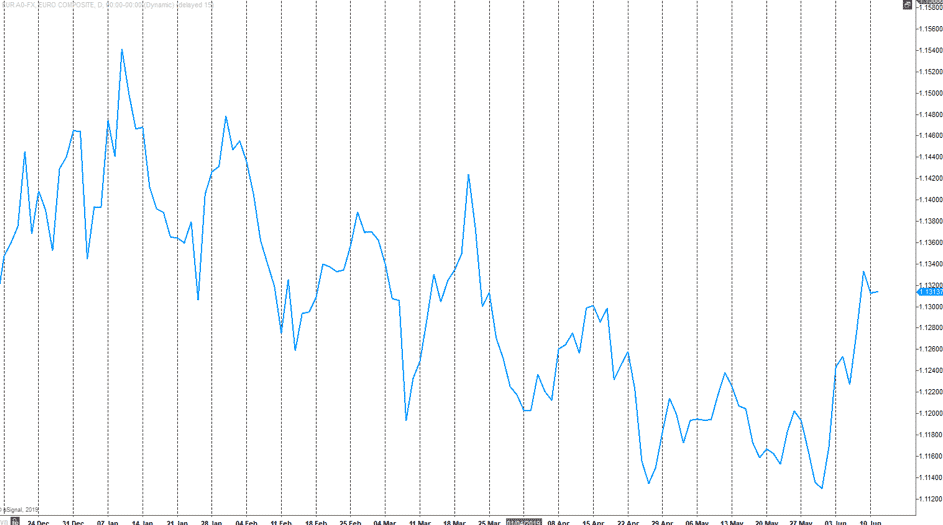
1. Line Chart
The most basic chart as it represents only the closing prices over a set period of time.
Daily EURUSD Line Chart
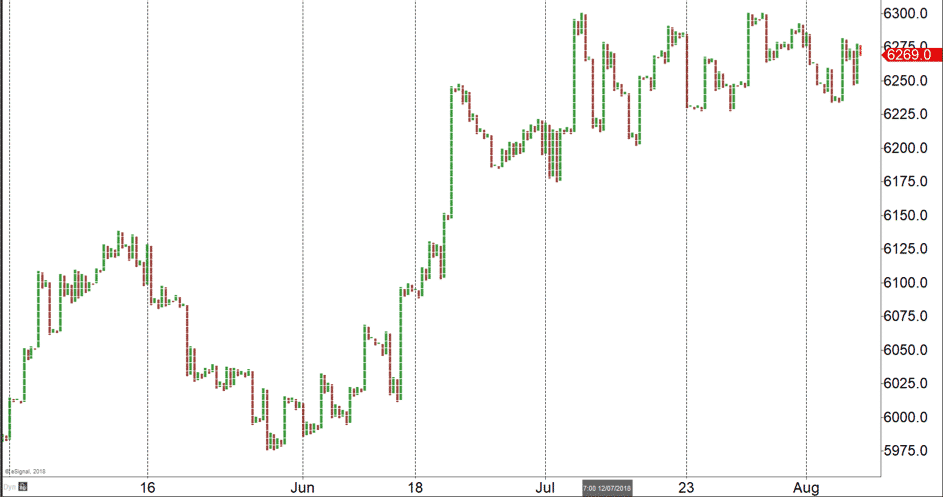
2. Bar Chart (or OHLC) Chart
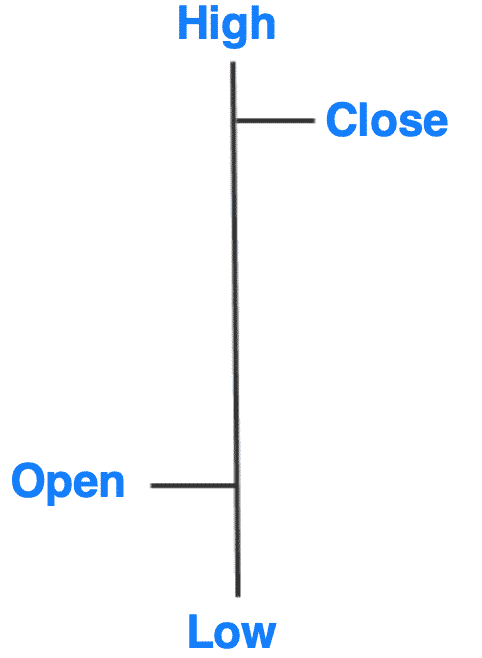
- The vertical line represents the High and Low for the trading period
- The close and open are represented on the vertical line by a horizontal dash
- The Open on the left of the vertical line and the Close on right
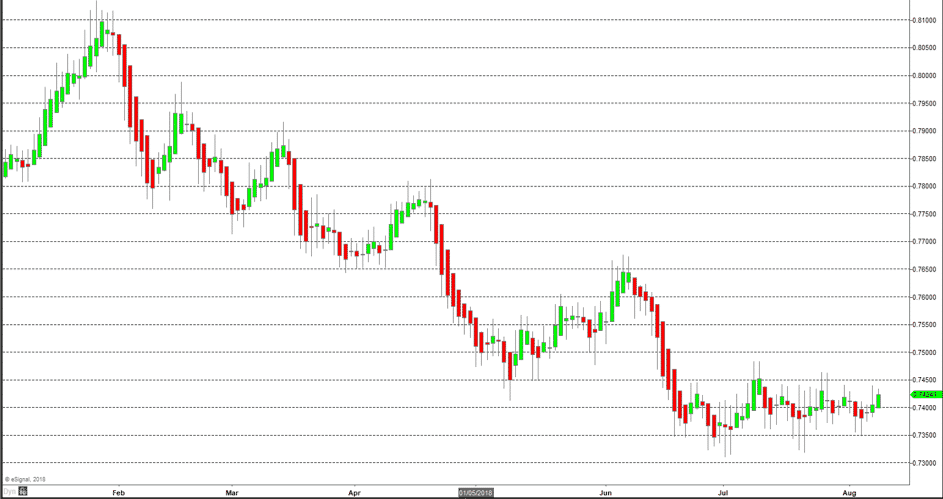
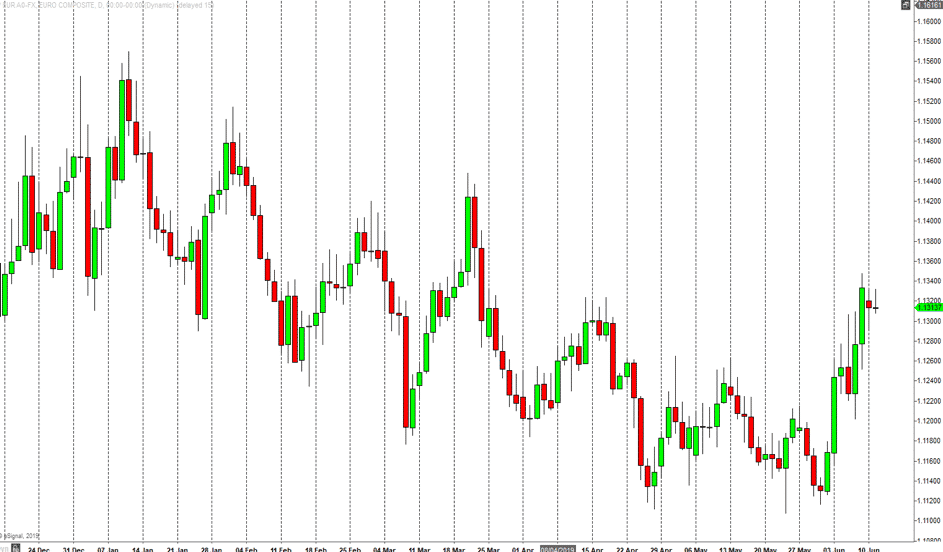
3. Candlestick Chart
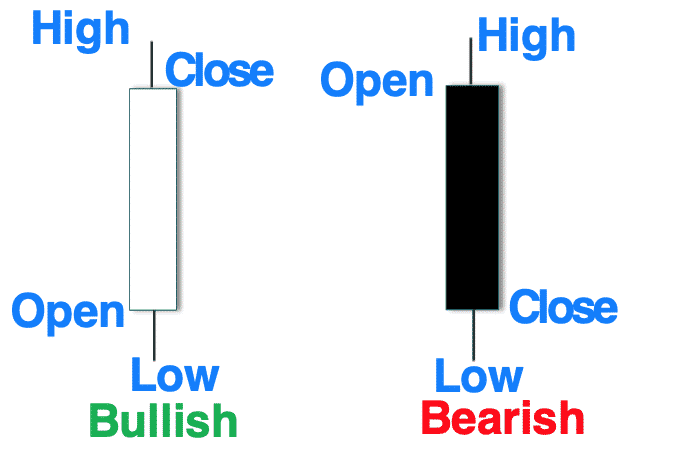
- The candlestick chart is similar to a bar chart, but it differs in the way that it is visually constructed
- The candlestick is the formation of a wide bar on the vertical line, which illustrates the difference between the open and close. This is called the Body or Real Body
- If the close is lower than the open the Body is shaded in (often black or red)
- If the close is higher than the open, the Body is usually clear (or white or green)
- The thin lines above and below the real body are called the shadows ((also called candlestick shadows, the upper shadow the wick, the lower shadow the tail)
- The peak of the upper shadow is the high of the period and the bottom of the lower shadow is the low of the period
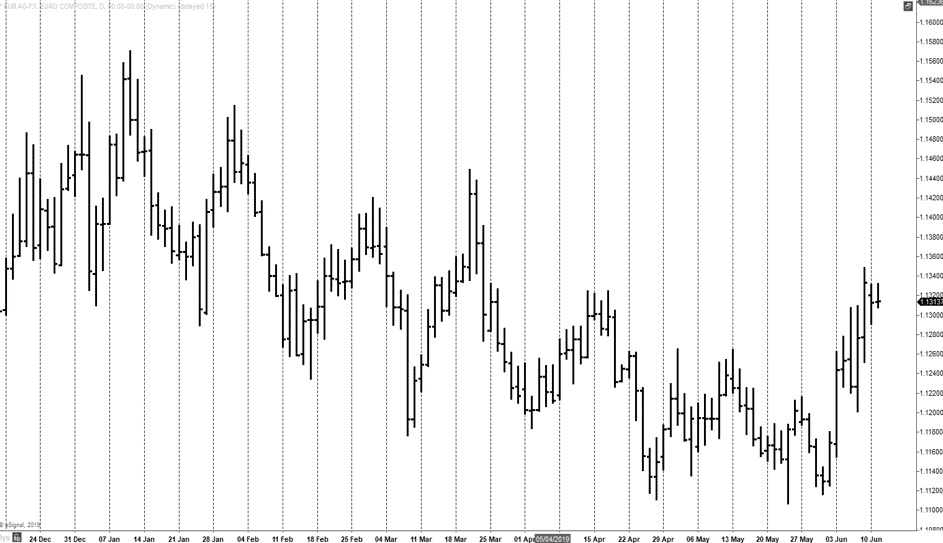
Daily EURUSD Bar (OHLC) Chart
4. Other Chart Types
These would include:
- Point & Figure
- Market Profile
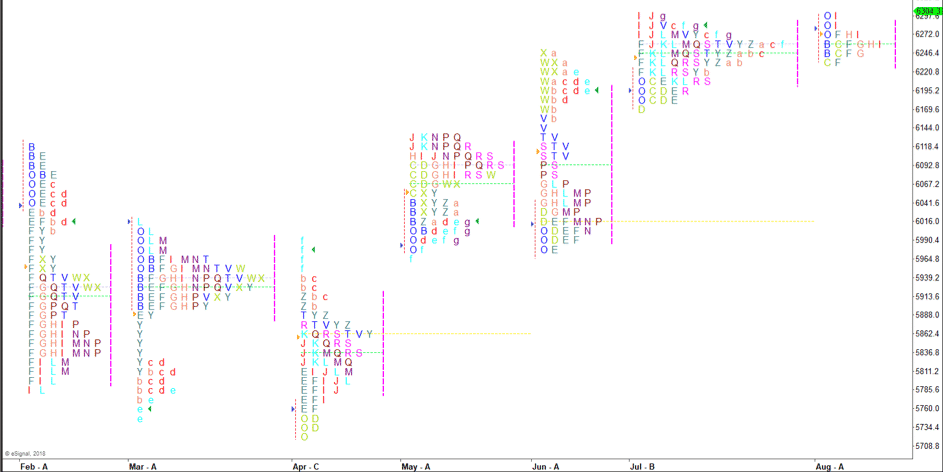
- Heikin-Ashi