A Doji candle can be an important signal in candlestick analysis. Where the OPEN price is equal to the CLOSE price, a doji candlestick has formed.
Classically, a doji candle denotes uncertainty in the prevailing trend and is arguably a neutral signal. However, it would be wise not to dismiss them as trading signals. They denote the equal matching of the buyers and sellers. If the prevailing trend is strong, the appearance of a doji can therefore be the early sign of trend change. Whereas, a small doji candle as part of a consolidation range is considered to be a very weak trading signal.
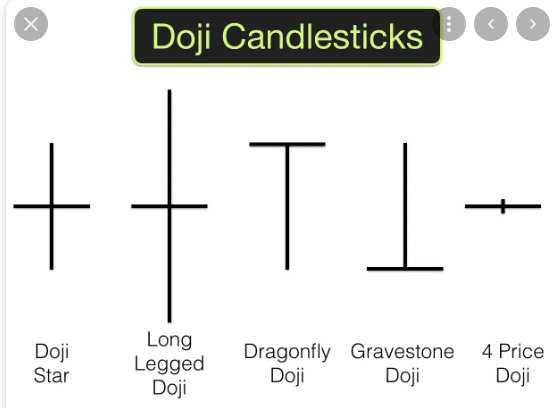
Although the standard form of a doji pattern is a plus sign, it can also take other forms. The level of the OPEN and CLOSE prices of the doji candlestick, relative to the HIGH and LOW prices can also be important.
Doji can be single-period signals but can also feature as part of several other multi-period candlestick set-ups (such as the Morning Doji Star and the Evening Doji Star).
| DOJI | |
| Price action | The OPEN and CLOSE prices are the same. The position of the HIGH and LOW prices determine the type of doji candle (see below). |
| Doji types | Doji (classic) Small HIGH/LOW range, OPEN and CLOSE in the middle of the candle. This very much denotes uncertainty in the market. |
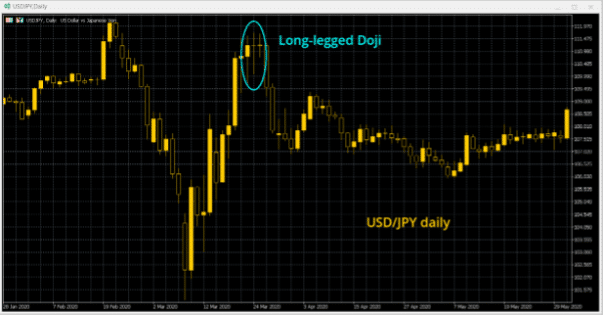
| Long-legged Doji Large HIGH/LOW range, OPEN and CLOSE in the middle. The wide range reflects significant volatility. | |
| Gravestone Doji OPEN and CLOSE at the LOW of the session, with a long upper shadow to the HIGH. This shows a big rejection of a move higher. It is very similar to a Shooting Star if at the end of an uptrend. | |
| Dragonfly Doji OPEN and CLOSE at the HIGH of the session, with a long lower shadow to the LOW. A significant rejection of a move lower can be a big reversal signal at the end of a downtrend and would be similar to a Hammer. | |
| Four Price Doji OPEN and CLOSE at the same level with the HIGH and LOW almost entirely the same too. This denotes a dead market. This will tend to be seen during significant market holidays. It is a signal that tends to be ignored. It is probably best to wait for another candle. | |
| Time horizon | Doji can be effective across all time scales from 5-minute charts up to hourly, daily and weekly. The longer the time horizon, the more significant the uncertainty becomes. |
| Psychology | The indecision of a doji appearing after a run of strong candles is a warning of a potential shift in the psychology of the market. |
| Confirmation | The next candlestick is necessary for confirmation. If the change of trend continues with the next candle, this confirms the significance of the doji. |
| High Conviction | By definition, a doji denotes indecision. Therefore, the next candlestick is important for conviction.Doji candles seen at the end of a long run of strong trending candles can be an important signal. |
| Lower Conviction | A doji candle coming in the middle of a consolidation phase would simply be suggesting a continuation of the uncertainty. |
| A warning | Trading off a doji in isolation can be risky and is ideally part of a larger suite of signals. |
| Potential Stop-Loss | Stop-losses would need to be placed outside the HIGH/LOW range of the doji. |
