Candlestick patterns are an exciting tool that traders can use when trading to diversify their trading experience and potential secure profits. This article will explore the world of candlesticks from the very basics of what they are to how best to trade them. They are a way to read the market from a different lens and can help traders make informed decisions. Now we will dive into candlesticks and how they can help you in the markets.
- What are Candlestick Patterns
- The Candlestick Components
- Types of Candlestick Patterns
- Popular Candlestick Patterns
- Making Candlestick Patterns Work for You
- Common Mistakes to Avoid
- Tools and Resources
- Final Thoughts
What are Candlestick Patterns
At their core, candlestick patterns are the financial world’s visual language. Imagine them as the brushstrokes on a canvas, each telling a unique story of market sentiment and price action. These patterns have stood the test of time, originating in 18th century Japan and persisting as a trusted tool in the modern trading landscape.
But what makes candlestick patterns truly indispensable? They provide traders with unparalleled insights into price movements and the psychology of market participants. They offer a unique perspective on market data, with each candlestick chart ingeniously compressing information from multiple time frames into singular, expressive price bars. From there you can decipher crucial information about price opens, closes, highs, lows, and the battle between buyers and sellers.
The Candlestick Components
Each candlestick consists of essential elements that convey critical information about price movements during a specific time frame. Understanding these different parts is much like deciphering a code that can helps you with your trading decisions.The parts are as follows:
The Body
The central part of a candlestick, known as the “body,” represents the price range between the opening and closing prices during the chosen time frame. The body can take on various shapes and sizes, indicating the intensity of buying or selling pressure. A solid (filled) body typically represents a bearish sentiment, suggesting that the closing price is lower than the opening price. Conversely, a hollow (unfilled) body implies a bullish sentiment, indicating that the closing price is higher than the opening price.
The Wicks or Shadows
Above and below the body, you’ll find thin lines known as “wicks” or “shadows.” These lines extend from the body and represent the price extremes reached during the time frame. The upper wick shows the highest price reached and the lower wick shows the lowest price. Understanding the wicks is crucial for gauging price volatility and the battle between bulls and bears.
The Wick Length
The length of the wicks relative to the body can provide further insights. A long upper wick suggests that buyers attempted to push prices higher but faced strong resistance, potentially indicating a reversal or a bearish sentiment. Conversely, a long lower wick implies that sellers tried to drive prices lower, but were met with significant support, possibly signalling a bullish reversal or sentiment shift.
The Wick’s Position
The position of the wicks relative to the body is also noteworthy. If the upper wick is longer than the lower wick, it signifies that bears had more control during the session. Conversely, a longer lower wick suggests that bulls had the upper hand. These observations can help you assess the dominance of buyers or sellers.
So, with the foundation of candlestick anatomy firmly in place, let’s move forward to unravel the diverse world of candlestick patterns and discover how they can guide your trading journey.
Types of Candlestick Patterns
Now you know the basics about candlestick charts we can look in more detail at the different candlestick patterns. There are various different types of these patterns, all of which are important. Now, we explore the major categories of candlestick patterns:
Bullish Patterns
Bullish candlestick patterns signify optimism in the market. They suggest that buyers are gaining control and that upward price movement may follow. We’ll delve into patterns like the Hammer, Morning Star, and more.
Bearish Patterns
Conversely, bearish candlestick patterns signal pessimism. They indicate that sellers are gaining the upper hand, and downward price movement could be on the horizon. We’ll examine patterns such as the Shooting Star and Evening Star.
Reversal Patterns
Reversal patterns are like turning points in a story. They suggest a potential change in the prevailing trend. Patterns like the Doji and the Engulfing Patterns fall into this category.
Continuation Patterns
Continuation patterns, as the name implies, indicate that the current trend is likely to persist. These patterns provide insights into moments of pause before a trend continues. Examples of these are the Rising Three Methods and Falling Three Methods.
By understanding these categories, you’ll gain valuable insights into market sentiment and potential price movements.
Popular Candlestick Patterns
We will now take a closer look at some of the most popular and frequently encountered candlestick patterns. These patterns serve as the building blocks of candlestick analysis and are essential for traders to recognize:
| Candlestick Pattern | Description |
| The Doji | A Doji is a unique candlestick with an open and close price that are nearly identical. It suggests market indecision and can foreshadow reversals. |
| The Hammer | A Hammer is characterised by a small body and a long lower wick. It often signals a potential bullish reversal after a downtrend. |
| The Shooting Star | The Shooting Star features a small real body at the lower end of the trading range with a long upper wick. It’s a bearish reversal signal. |
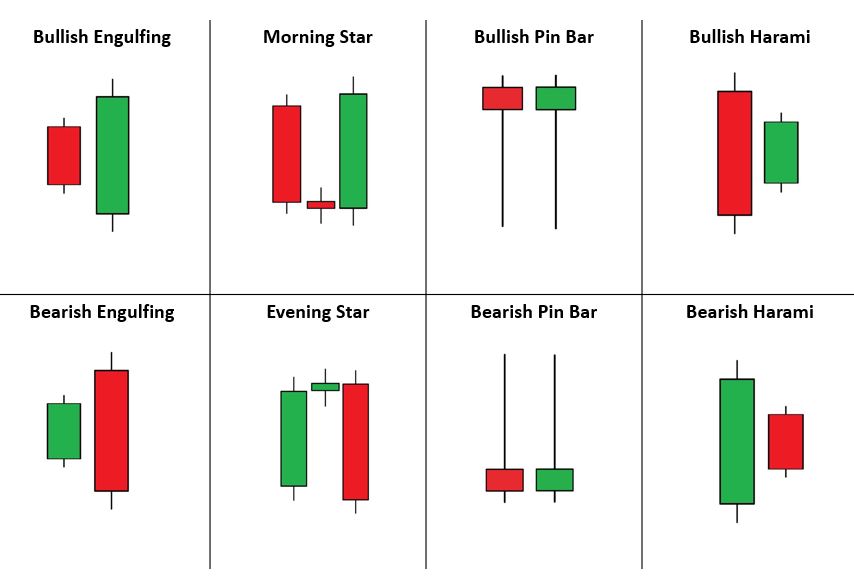
| Engulfing Patterns (Bullish and Bearish) | Engulfing patterns occur when one candlestick engulfs the previous one, signifying a potential reversal in sentiment. |
| Morning and Evening Stars | These three-candle patterns signal potential reversals and are particularly powerful when they occur after an established trend. |
Making Candlestick Patterns Work for You
Understanding candlestick patterns is one thing; putting that knowledge to work effectively is another. In this section, we’ll explore practical steps to incorporate candlestick patterns into your trading strategies:
Select Your Preferred Time Frame: Determine the time frame that aligns with your trading goals, whether it’s day trading, swing trading, or long-term investing.
Identify Key Support and Resistance Levels: Combine candlestick patterns with support and resistance analysis to confirm potential reversals or continuations.
Use Confirmation Signals: Don’t rely solely on candlestick patterns; use additional technical indicators and chart patterns to confirm your trading decisions.
Practice, Practice, Practice: Demo trading allows you to hone your skills without risking real capital. Practice recognizing and trading with candlestick patterns.
Risk Management: Set stop-loss orders to limit potential losses and adhere to a risk-reward ratio that suits your trading strategy.
By integrating these practical steps into your trading routine, you’ll be better equipped to harness the predictive power of candlestick patterns and make more informed decisions.
Common Mistakes to Avoid
As you venture into the world of candlestick patterns, it’s essential to be aware of common mistakes that traders often make. Avoiding these pitfalls can save you from unnecessary losses and frustration:
Overtrading: Resist the temptation to trade every candlestick pattern you spot. Quality over quantity is key.
Ignoring Context: Failing to consider the broader market context and other technical indicators can lead to misinterpretations.
Neglecting Risk Management: Not setting stop-loss orders or risking too much capital on a single trade can be detrimental to your account.
Impatience: Be patient and wait for candlestick patterns to fully form before taking action. Premature entries can be risky.
Confirmation Bias: Don’t exclusively rely on one pattern; always seek confirmation from other indicators or patterns.
By being mindful of these pitfalls, you can navigate the world of candlestick patterns with greater confidence and prudence.
Tools and Resources
To master the art of candlestick patterns, it’s beneficial to leverage tools and educational resources. Here are some valuable assets to aid your journey:
Charting Platforms: Explore trading platforms that offer advanced charting features and the ability to customise candlestick patterns.
Books and Courses: Numerous books and online courses are dedicated to candlestick analysis, providing in-depth knowledge and practical insights.
Online Forums and Communities: Join trading communities where you can exchange ideas, seek advice, and learn from experienced traders.
Practice Accounts: Most brokers offer demo accounts for practice trading with virtual funds, allowing you to refine your skills without risk.
Trading Journals: Keeping a trading journal to track your progress can be useful to document your trades and analyse your successes and failures.
Candlestick Patterns, Final Thoughts
In your exploration of candlestick patterns, you’ve embarked on a journey that can significantly enhance your trading expertise. These ancient yet timeless tools offer a unique window into market sentiment, allowing you to anticipate price movements and make well-informed decisions.
It is important to remember mastering candlestick patterns requires dedication, practice and an eye for detail. If you can understand the nuances of candlestick patterns it can be a significant edge in the trading world.
As you move forward with your trading, remember:
- Patience is a Virtue: Waiting for the right patterns and confirmations is often more rewarding than rushing into trades.
- Risk Management is Key: Protecting your capital with prudent risk management strategies is crucial for long-term success.
- Continuous Learning: The world of trading is ever-evolving. Stay curious and never stop learning.
- Community and Mentorship: It is often helpful to engage with other traders and look for support and mentorship.
Now, it’s time to put your knowledge to work.
