When operating in any part of the financial markets, mastering technical analysis tools is essential for traders and investors. One such tool that holds significant importance is the Exponential Moving Average (EMA).This article looks at how the EMA is calculated and explores how it can be leveraged to make informed trading decisions.
- Understanding Moving Averages
- What is the EMA and its Importance in Technical Analysis
- Calculating the EMA
- Choosing the Right EMA Period
- Interpreting EMA Signals
- Implementing EMA Strategies
- EMA Variations and Enhancements
Understanding Moving Averages
Moving averages are statistical indicators that smooth out price data by creating a constantly updated average price over a specific time period. They help traders identify trends, gauge the strength of price movements, and filter out noise from market fluctuations.
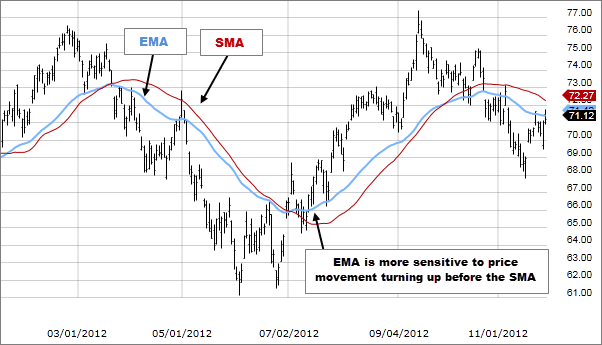
While there are several types of moving averages, the two most commonly used are the Simple Moving Average (SMA) and the Exponential Moving Average (EMA). SMA calculates the average of closing prices over a specified period equally, whereas EMA places greater weight on recent prices, resulting in a more responsive indicator to current price movements. The choice between SMA and EMA depends on trading preferences and objectives.
What is the EMA and its Importance in Technical Analysis
The Exponential Moving Average (EMA) is a type of moving average that places greater emphasis on recent price data while still considering historical prices. Unlike the Simple Moving Average (SMA), which assigns equal weight to all data points, the EMA assigns more weight to recent prices, making it more responsive to changes in price trends. This makes EMA a preferred choice for traders seeking timely signals and smoother trend identification in dynamic market environments.
EMA is widely used by traders and investors for trend identification, signal generation, and risk management purposes. Its ability to react quickly to price changes makes it a valuable tool for spotting trend reversals, determining entry and exit points, and confirming the strength of price trends.
Calculating the EMA
Select a timeframe: Determine the time period for which you want to calculate the EMA. This could be any duration, such as 10 days, 20 days, or 50 days, depending on your trading strategy and objectives.
Gather price data: Collect the closing prices of the asset for the selected timeframe. Ensure that you have enough data points to calculate the EMA effectively.
Calculate the Simple Moving Average (SMA): Calculate the SMA for the chosen period by summing up the closing prices and dividing by the number of periods.
Calculate the multiplier: Determine the multiplier (weight) to be applied to the most recent closing price. The formula for the multiplier is 2 / (N + 1), where N is the number of periods.
Calculate the initial EMA: Use the SMA calculated in step 3 as the initial EMA for the first data point.
Calculate subsequent EMAs: For each additional data point, apply the EMA formula:
EMA = (Closing Price – EMA_previous) * multiplier + EMA_previous
Repeat this process for all data points to calculate the EMA for the entire time frame.
Example of EMA calculation
To illustrate the calculation process, let’s consider a 10-day EMA for a stock:
- Day 1: Closing price = $50, SMA = $50 (initial EMA)
- Day 2: Closing price = $55, EMA = ($55 – $50) * (2 / (10 + 1)) + $50 = $52.27
- Continue this calculation for each subsequent day to obtain the complete EMA series.
Choosing the Right EMA Period
The choice of EMA period significantly impacts the responsiveness and reliability of the indicator. Shorter EMA periods react more quickly to price changes but may generate more false signals, while longer EMA periods provide smoother trends but may lag behind significant price movements.
Factors to consider when selecting EMA period
Trading style: Short-term traders may prefer shorter EMA periods (e.g., 10 or 20 days) for quick signals, while long-term investors may opt for longer EMA periods (e.g., 50 or 200 days) for trend confirmation.
Volatility of the asset: Highly volatile assets may require shorter EMA periods to capture price fluctuations effectively, whereas less volatile assets may benefit from longer EMA periods to filter out noise.
Market conditions: Consider the prevailing market conditions and the timeframe of your analysis. In volatile markets, shorter EMA periods may be more suitable, whereas in trending markets, longer EMA periods may provide better trend confirmation.
Interpreting EMA Signals
Bullish and bearish signals
Crossover: When the shorter EMA crosses above the longer EMA (a “bullish crossover”), it signals a potential uptrend and may be interpreted as a buy signal. Conversely, when the shorter EMA crosses below the longer EMA (a “bearish crossover”), it indicates a potential downtrend and may signal a sell.
Divergence: Divergence between price and EMA can also provide valuable signals. Bullish divergence occurs when prices make lower lows, but the EMA makes higher lows, indicating a potential reversal to the upside. Bearish divergence, on the other hand, occurs when prices make higher highs, but the EMA makes lower highs, signalling a potential reversal to the downside.
Confirmation and validation
It’s essential to confirm EMA signals with other technical indicators, such as volume, momentum oscillators, and support/resistance levels, to validate the strength and reliability of the signals. Additionally, consider the overall market context and fundamental factors to avoid false signals and improve the accuracy of your trading decisions.
Implementing EMA Strategies
EMA as a trend-following indicator
Identifying trends: EMA crossovers can help traders identify trends and potential trend reversals. A bullish crossover (shorter EMA crossing above longer EMA) suggests an uptrend, while a bearish crossover (shorter EMA crossing below longer EMA) indicates a downtrend.
Trading with the trend: Traders may use EMA crossovers to enter trades in the direction of the trend. For example, in an uptrend, traders may look for buying opportunities when the shorter EMA crosses above the longer EMA.
EMA as a dynamic support and resistance
Support levels: During uptrends, EMAs often act as dynamic support levels, where prices tend to find buying interest near the EMA. Traders may consider buying opportunities when prices pull back to the EMA in an uptrend.
Resistance levels: Conversely, during downtrends, EMAs serve as dynamic resistance levels, where prices encounter selling pressure near the EMA. Traders may consider selling opportunities when prices rally to the EMA in a downtrend.
EMA Variations and Enhancements
Multi-timeframe analysis
Combining multiple EMAs: Traders may use multiple EMAs with different periods (e.g., short-term EMA and long-term EMA) to gain a broader perspective on the trend. For example, a bullish crossover of a short-term EMA above a long-term EMA may be used as a confirmation signal for trend continuation.
Higher timeframe analysis: Traders may use EMAs on higher timeframes (e.g., daily and weekly) to identify longer-term trends and align their trading decisions with the broader market direction.
EMA with other indicators
MACD (Moving Average Convergence Divergence): The MACD indicator combines two EMAs to generate trend-following signals and identify momentum shifts in the market. Traders often use the MACD histogram and signal line to confirm EMA signals.
RSI (Relative Strength Index): Traders may use the RSI indicator in conjunction with EMAs to identify overbought and oversold conditions in the market. Divergence between price and RSI, combined with EMA signals, can provide valuable insights into potential trend reversals.
As with any technical indicator, mastering the use of EMAs requires practice, experimentation, and continuous learning. Traders are encouraged to test different EMA strategies in simulated environments, adapt them to their trading style and risk tolerance, and stay updated with market developments to refine their trading approach over time.
