What is the RSI?
The Relative Strength Index (RSI) is a technical analysis indicator that is a measure of momentum in the price movement. The RSI measures the magnitude of the price change. It is an oscillator indicator (values move between 0 and 100) developed by a technical analyst called John Welles Wilder Jr.
The RSI can help to identify:
- The strength of a trend
- Whether an instrument is becoming overbought/oversold
- Potential changes in trend
N.B. The Relative Strength Index should not be confused with the Relative Strength Ratio, which measures the price performance of one instrument relative to another.
The calculation
Here is the calculation for the RSI:
RSI = 100 – 100/1+RS
(RS= The average gain over the number of periods divided by the average loss over the periods)
Welles Wilder classicly used 14 periods for his calculation. However, trading software allows you to adjust this to whatever suits your needs. The lower the number of periods in the calculation, the more sensitive the RSI is to price changes. Some traders will reduce the periods of the calculation to 9. This can mean earlier signals but it may also result in more false signals.
The RSI can work over any time frame. So, using Welles Wilder’s 14 periods, this means using a 14-day RSI on a daily chart, a 14-hour RSI on an hourly chart and a 14-period RSI on a 15-minute chart.
What does the RSI tell us?
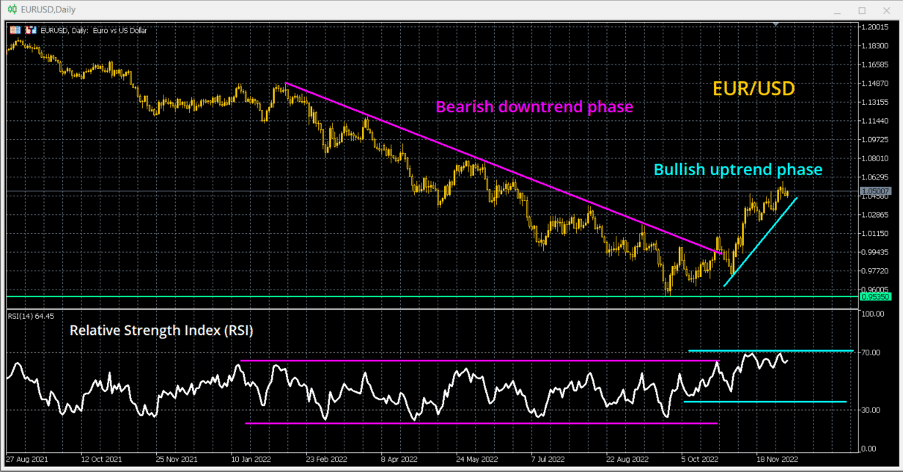
The RSI can tell us a lot about the state of a trend. Welles Wilder believed that the RSI could tell when an uptrend or downtrend was beginning to become exhausted. The RSI oscillates between 0 and 100, with 50 being the mid-point. Classically, he saw anything above 70 beginning to be becoming overbought, whilst anything below 30 was becoming oversold.
However, the RSI should be read differently in different markets:
- RSI in an uptrend – the RSI can hold above 70 for some time, this can reflect the strength of the uptrend. In an uptrend, the RSI will tend to oscillate between 40 and 80.
- RSI in a downtrend – the RSI can hold below 30 for some time, reflecting the strength of the downtrend. In a downtrend, the RSI typically oscillates between 20 and 60.
- RSI in a neutral market – when there is no trend, the RSI will often not reach 30 or 70. Instead, there tends to be a neutral oscillation between 35/65.
Trading with the RSI
Traders can use the RSI to generate signals. The important aspect the remember is to identify the trend and then use the RSI for signals accordingly:
- In an uptrend, using unwinding moves lower on the RSI towards 40/55 as a buy signal.
- In a downtrend using technical rallies that unwind the RSI higher towards 45/60 as a sell signal.
It is important to remember that in an uptrend the RSI can remain stretched above 70 for some time. Subsequently, using sell orders just because the RSI is above 70 is a very risky strategy. Similarly, in a downtrend, buying when the RSI is below 30 is also a high-risk strategy.
RSI divergences
A divergence between moves in the price and the RSI is another important signal for the RSI. A “bearish divergence” (also known as a negative divergence) in an uptrend can be an early warning of an approaching decline in the price. When the price is making higher highs, but the RSI is making lower highs, this is a warning of a tired uptrend that may be due a correction.
Similarly, in a downtrend, we look for “bullish divergences” (or positive divergences) to signal potential recoveries. A run of lower lows on the price but higher lows on the RSI is the warning sign of a potential reversal.
