Trend lines and breakouts are an important part of any technical analysis trading strategy. Trend lines will help you figure out whether markets are in a trending stage or a consolidation phase. You’ll find them very useful when defining uptrends, downtrends, ranges and breakouts.
Being able to draw trend lines and identifying real breakouts are key if you want to use technical analysis as your trading approach.
What Is a Trend Line In Trading?
A trend line is a line that’s drawn between two points — generally off of notable highs or lows. You’ll use these lines to define a trend or a consolidation pattern. When a market’s trending, the line would be drawn off the highs in a downtrend and the lows in an uptrend.
How Do Trend Lines Work?
Trend lines work by defining support and resistance which you can then use to enter or exit trades. They also let you know when a market might change direction — for example, from bullish to a neutral phase. Or from a sideways stage to a bearish or bullish trend with a breakout.
How To Draw Trend Lines
To draw trend lines, you could simply join notable swing highs and swing lows. However, it’s not as simple as that. It doesn’t matter whether you’re drawing trend lines on stock charts or forex charts, it’s getting a basic understanding of Dow Theory that’ll help you draw trend lines. Here, we’ll show you the correct ways of drawing them.
What Are The Different Types Of Trend line?
The different types of trend lines are broadly categorised as:
- An uptrend line
- A downtrend line
- A sideways, or consolidation trend line
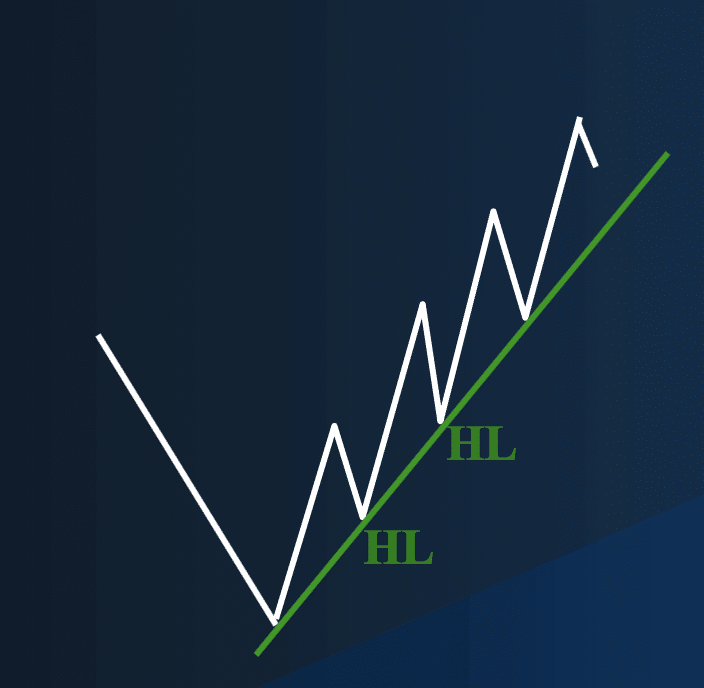
Uptrend (Higher Lows)
An uptrend is a series of higher highs and higher lows. As you’ll see in the image below, the trend line is drawn by connecting successive swing lows that define the uptrend. You can then use this up trend line as support.
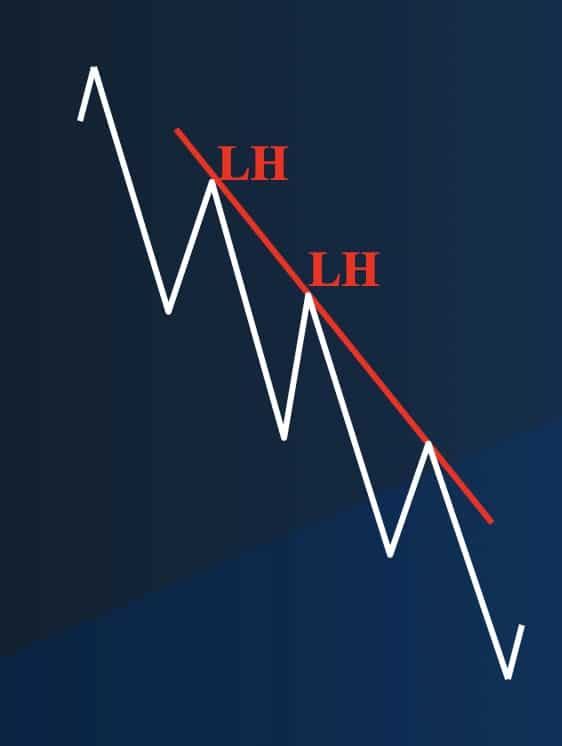
Downtrend (Lower Highs)
You’ll recognise a downtrend by a series of lower lows and lower highs, seen in the image below. Simply connect the significant highs with your trend line and you’ll be able to use it as resistance.
Sideways
In sideways, ranging market you can also draw trendlines that don’t define an up or downtrend, but actually define the consolidation. This ties in with what we looked at in our article on chart patterns.
What Are The Pros and Cons of Trend Line Trading?
Pros Of Trend Line Trading
The advantages of trend line trading are:
- A trend line break signals the end of a trend — You can define when a trend concludes when the trend line is broken
- Can help to define trade entry levels— You can use breaks of trend lines as entry levels for your trading strategies
- Can help to define trade exit levels— You could use a breach of a trend line as a reason for exiting a trade, to place an exit stop on a break of a trend line
- Trend line trading can provide earlier signals (than when using other indicators) — Earlier signals are often generated from using a trend line to enter or exit trades, as opposed to using other support and resistance levels for signals
- You can increase you profits — The above uses of trend lines can improve your profits (though fake breaks could be negative for profits — see the cons of trend line trading below)
Cons Of Trend Line Trading
- The main disadvantage of trend line trading is that, sometimes, fake signals are given. For example, in an uptrend, the rising trend line might break, but the next support might hold, and the uptrend may then resume
- Breakouts from sideways, consolidation ranges can also sometimes also be fake (or fakeouts as they are now often called)
What Is Breakout Trading?
Breakout trading is when you identify that a market is going sideways and look to benefit from a breakout of the range. The assumption that this will start of a new trend in the direction of the breakout.
How Do Breakouts Work?
Breakouts work by identifying that the market has moved from a trend to a non-trend and then looking for a breakout from this range. Follow these steps:
- First, look at the market and identify that it’s no longer in a trend. Instead, it would’ve established upper and lower boundaries and would be moving between these in a range.
- Second, you’d then look to establish range support levels (or areas) and range resistance levels (or areas). This would be done by looking at failure highs and rebound lows that have been established during the formation of the trading range.
- Once you’d identify upper resistance zones and lower support zones you can look to enter trades on breakouts from these support and resistance levels.
- Then, you’d look to sell (enter short positions) as the market breaks out below the support areas. Or, you’d buy (enter longs) as the market moves above resistance zones.
- Key here is going to be stop loss placement. Place the stop loss above the top of the identified resistance when selling the breakout to go short. You’d also place the stop loss below the defined support, when buying the breakout to go long.
Alongside a support and resistance indicator, it’d also be useful for you to use a technical momentum indicator to assist in the timing of the breakout entry.
What Are Some Examples Of A Breakout?
Examples of breakouts include unsuccessful, fake and successful breakouts. Here, we’re going to look at this in action.
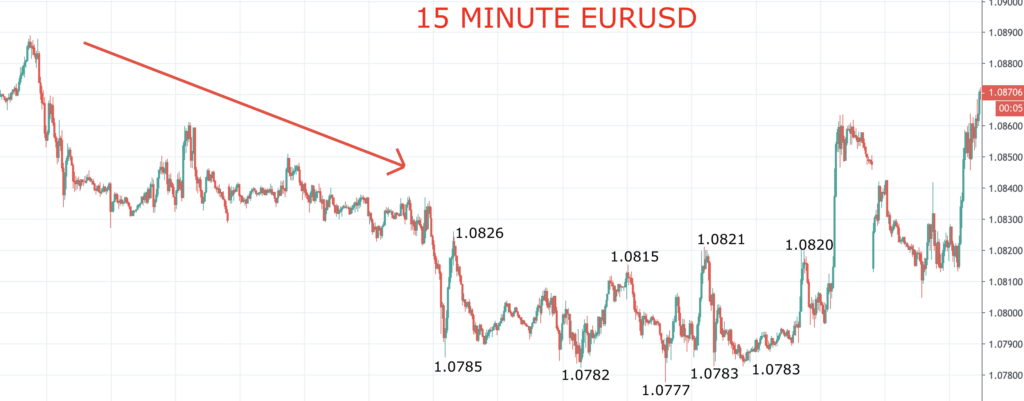
- In our example, EURUSD signalled a move from a downtrend (indicated by the red down arrow). It moved to a non-trend, trading range, between 1.0826 as resistance and the 1.0785 and 1.0782 lows as support.
- The market then rebounded and had pullbacks in between these parameters.
- Then there was a fake bearish breakout, with the push down to 1.0777.
- The market didn’t continue lower and quickly reverted back within the trading range.
- You’d have been able to avoid a short breakout position, but only if you’d used a price or time filter to trade it.
- EURUSD then continued back within the trading range, with up moves stalling back from below the 1.0826 resistance level (from 1.0821 and 1.0820). Down moves rebounded from above the 1.0782 support level (twice from 1.0783).
- Eventually, however, the market signalled a bullish breakout from the trading range, above 1.0826, which was categorised by an aggressive, impulsive move higher.
- This would’ve been a successful bullish breakout from the sideways, trading range, as EURUSD climbed significantly higher.
What Are The Pros and Cons Of Breakout Trading?
The pros and cons of breakout trading are as follows:
Pros Of Breakout Trading
There are significant advantages to breakout trading:
- Breakout trading means that you can catch a new trend at the start of the trend, as trades are entered at the breakout for new bullish and bearish trends
- It means that you don’t have to wait for a trend to be fully established
- Exit or stop loss levels can usually be easily identified from the breakout range
- Breakout trading can allow for the placing of tight stop-losses, limiting trading losses from fake breakouts.
Cons Of Breakout Trading
The cons of breakout trading can be identified as follows:
- Fake breakouts: These are a possibility when the market breaks out above a resistance level or below a support level, but then fails to establish a new bull or bear trend respectively. The market may revert back to the trading range, but there’s little you’re able to do about this, though active stop and risk management can help
- Breakout, but weak new trend: Another con is that it may be the case that the market does break out from the range, BUT it may not move far enough to hit your ‘take profit’ target. This would then see a risk for a move back within the range before the new trend fully starts.
Trend lines and Breakouts Summary
We’ve looked at the importance of trends and trend lines analysis and the pros and cons of trend line trading. We’ve also detailed how breakouts work and the positive and negatives with this trading tactic. These two approaches are important tools for both beginner and advanced technical traders, and you should look to master them.
