Trading charts can be used to plot the price of any market; forex, stocks, bonds, commodities and more, any market where the price changes.
Charts are at the core of technical analysis. For you, the trader, an understanding of different chart types is vital when using technical analysis and helps you make informed trading decisions
Charts are a graphical representation of market price action. This is a complicated way of saying that charts show us what the price is doing, usually (though not always) plotted against time. In our article What Are Trading Charts Part 2, we’ll look at the different types of charts in more depth.
In this article, we’ll focus on:
• How charts work
• Why they are important
• How to read them
• How to trade using the charts
• When charts should be used
• What to consider when using charts for trading
How do Trading Charts Work?
Trading charts work by allowing you to study the changes in the price of the underlying asset over a period of time. For this purpose, you can use a charting or technical analysis platform that’s linked to a market data feed. The market data may be in real-time to show forex, index or stock charts live. However, sometimes the information is delayed by a certain period, maybe 10 minutes, or perhaps until the end of the trading day.
Before the advent of computers for delivering this real-time market data, traders and analysts would receive prices via ticker tape, or at the end of the day via publications. Back then, the trading chart would be physically plotted, using pen and paper.
Today, traders and analysts have access to super-fast data delivered to high-powered computers that can display the market price data in a multitude of ways.
Trading Charts Explained
The ways in which the data is displayed has progressed throughout the decades, as we touched on in our article on What is Technical Analysis. Today, there are many ways you can look at the price to develop a trading strategy and in turn make better trading decisions. Trading time frames are not limited to certain asset classes, stock charts aren’t just for long-term investing and forex isn’t just for day trading. The combinations of chart time frames and instruments are huge. For more information about types of trading chart, also see our next lesson “What Are Trading Charts Part 2.
Why are Trading Charts Important?
Trading charts are important because for you as a trader they form the basis of the technical analysis approach to trading. Without the trading chart, the technical analyst (or chartist), would not have anything to analyse and would therefore, not be able to build a technical analysis strategy.
Charts form the basis of your technical analysis approach to financial markets trading and investing. They’re essential whether you’re stock trading, looking at futures trading charts, or if you are following day trading charts or forex trading graphs. By looking at charts and learning how to read the charts, you can see the behaviours and psychology of the whole market.
Remember, technical analysis states that the price discounts everything, so all of the trader’s and investor’s thoughts, feelings and sentiment are built into the price. Charts are a graphical reflection of the price and in turn of the entire market sentiment. That’s why they’re so important.
How to Read Trading Charts
Reading charts and fully understanding them is not easy, particularly if you’re a beginner. When you start in trading and take your first look at a chart, it will probably appear to be just a set of random lines on a graph.
The ability to read charts and to benefit from the information comes via education and practice. Firstly, it’s necessary to have an understanding of exactly what the charts represent. There are several types of charts and they all have different factors that make them more appropriate in certain situations. Again, we look at the different types of charts in the article What Are Trading Charts Part 2.
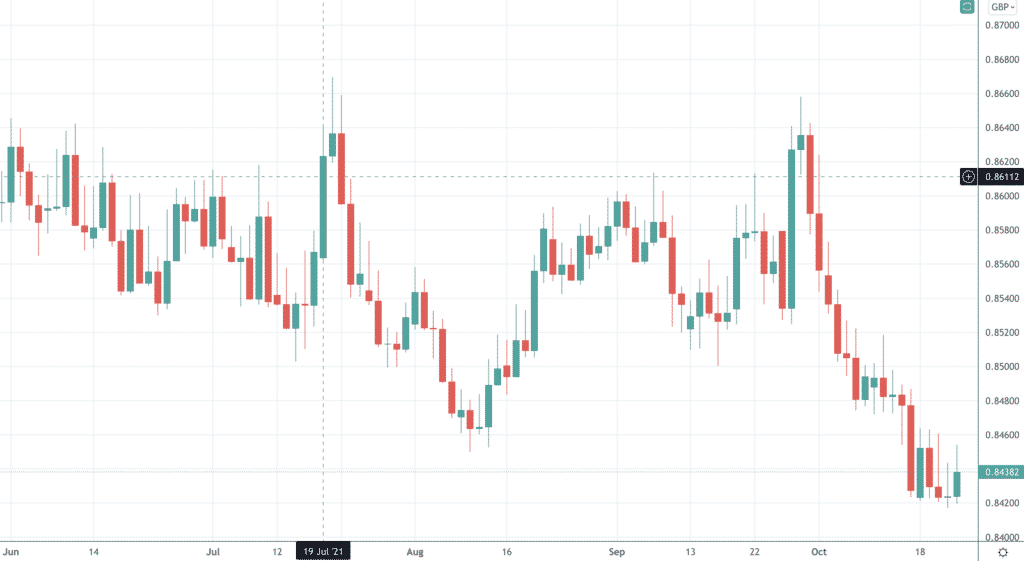
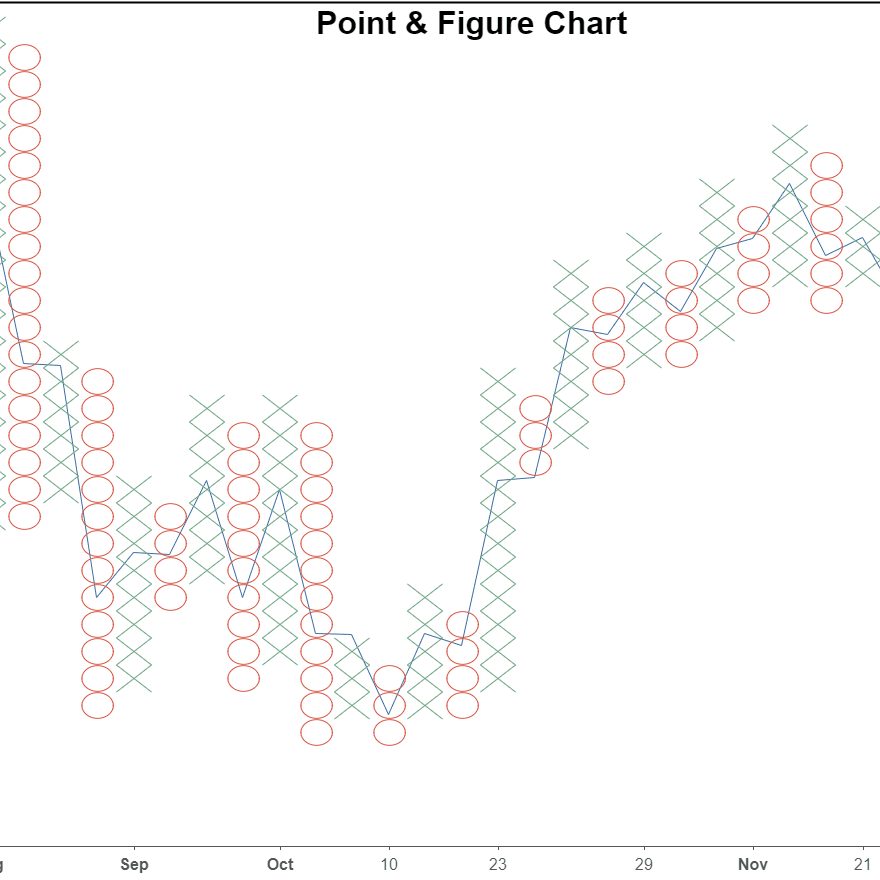
Generally speaking, charts display the price on the y-axis (the vertical axis, up the right or left side of the chart), and the time on the x-axis (the horizontal axis, usually along the bottom of the chart). As time moves on, the price changes are plotted on the chart, with various aspects of the price displayed in different ways. However, there are some price charts (Point & Figure and Market Profile, for example), that don’t show the data in this way.
How to use Live Trading Charts
Live trading charts are used to make real-time decisions and judgments about short-term trading strategies. If you are trading on a short-term time horizon, it is vital to look at live market data, to see the price changes as they occur in real-time. No matter the chart you’re looking at, a short-term trader needs to have access to real-time, live market data to be actively involved with the markets. If, however, you’re a longer-term trader or investor, a delayed market price data feed, or even an end of day data feed might be sufficient.
How to Trade Using Charts
Trading charts are primarily used in the technical analysis method of trading. You can identify differing price patterns that are formed or use mathematical indicators as well as various other approaches within technical analysis. You will principally use the chart for five different areas of your strategy.
- To identify the market price direction over your trade or investment timeframe. Is the market price likely to move up or move down over the expected time horizon of the trade or investment?
- The price level to enter the trade or investment, where to buy or sell?
- The price level at which the trade (or investment) might be exited, if profitable. That is the target for the trade (or investment).
- The price level at which the trade (or investment) is to be exited, if in a losing position. This is the exit stop for the trade (or investment).
- For in-trade management. The chart is used to decide on changes to the trade target and exit stop, once the trade has been entered.
When Should Trading Charts be Used?
Trading charts should be used across multiple asset classes and various timeframes. As mentioned above, principally, the art of reading charts is the discipline of technical analysts and technical traders. However, using charts is also advised, even if you don’t have a technical approach to your trading. Even if you approach the financial markets from a fundamental perspective (or another analytical method), you’re still likely to look at the price chart to supplement your view. As with the technical analyst, the fundamental trader or investor may use charts to decide on certain levels when entering or siting a trade or investment.
Best Charts For Trading
What are the best charts for trading? That’s very much a decision for you, and you’ll learn to make this decision as you learn more about technical analysis, and build your trading strategy. You might discover there are various best chart layouts for day trading and there may be certain best stock charts that you could use. However, generally speaking, most of the different types of charts we look at in the article What Are Trading Charts Part 2, can be used whichever financial market you’re trading.
It might be the case that some charts aren’t so well suited for specific timeframes of trading. Maybe you find that a candlestick chart does not work so well on very short-term charts, or perhaps Market Profile charts do not work so well on much longer timeframes. We would not, however, completely rule out any particular type of chart for any kind of trading. It is up to you how to utilise different chart types to suit your trading approach and strategy.
What to Consider when Trading With Charts
When using charts, it is essential that you fully understand what you‘re looking at.
Firstly, what is the data stream, where is it from, is it accurate, and is it live or delayed?
Second, are you using an appropriate chart for the asset class that you are trading, and does it fit with your trading strategy?
Third, does the chart type suit the timeframe of the analysis that you’re conducting?
Finally, have you done your research, have you educated yourself to be able to fully understand what the chart is telling you from a technical analysis standpoint?
Only if you can answer those questions with confidence can you appreciate what charts are and how they can be used to your advantage.
