Technical analysis is a way of assessing financial markets to be able to determine and hopefully predict future market price moves. It is also sometimes referred to as charting, with technical analysts being known as chartists.
Technical analysis is just one type of the many different approaches to market analysis that a trader, investor or analyst can use to predict the direction of financial markets. Different market analysis approaches you may encounter include fundamental analysis (which involves top-down and bottom-up approaches), strategic analysis, quantitative analysis, and technical analysis.
If you’re interested in learning how to trade the financial markets, technical analysis is a great way to start. We’ll explain how simple technical analysis can be …
Technical Analysis Basics
The job of a technical analyst is to look at financial markets to forecast future price moves with as much accuracy as possible. Analysts use past price data and charts, alongside various indicators, to identify patterns in the price. Once identified, the patterns make it easier to predict the price movements in the future with some degree of certainty.
Before we start, you need to understand the technical analysis basics. Getting started in technical analysis will initially require you to look at the core features. These three features are; the price discounts everything, markets move in trends and that history repeats itself.
The technical analysis basic assumptions are as follows:
- That the price discounts everything — this means that any factors that can and do influence the price of any asset class are built into the price. They are discounted into and reflected by the current price.
So, the current price would include:
- information from all of the events (the macroeconomic fundamentals) and the economic data that could impact the price.
- any and all possible geopolitical threats (like wars or acts of nature)
- all of the future expectations from authorities, like the central banks and government.
- all market participant emotions, thoughts, feelings, behaviours, psychology and positioning.
These are all discounted into the current price.
- Market prices tend to move in trends — markets move from stability (where you would see the price in a defined range), to then respond to new information and data. They then go into a less stable state (a state of disequilibrium). Markets will then trend up to higher prices or down to lower prices. They’ll then trend until they reach a new place of stability. The concept of trend is critical for you to understand when technical analysis trading.
- History tends to repeat itself — human behaviours and psychology tend not to change significantly over time. That means the thoughts, feelings, actions, and behaviours that were shown by previous market participants are likely to repeat themselves now and in the future. Let us think of the investor at the time of the Napoleonic wars, with the investor going into World War II. These individuals would have similar psychological and emotional reactions to their investing and trading.
Therefore, you will find that various market price patterns and trends that have occurred before will likely tend to repeat themselves, as the price patterns to some extent reflect investor and trader psychology and behaviours, represented in the market price.
Technical Analysis of Financial Markets
Technical analysis of the financial markets has been in use for far longer than many people appreciate. Joseph de la Vega introduced many technical analysis concepts in the 17th century. Munehisa Homma is the father of candlestick analysis and was trading on the Japanese rice markets in the 18th century. At the end of the 19th century, Charles Dow produced a series of articles for the Wall Street Journal, that formed the basis for trend-following technical analysis.
You can use technical analysis across all of the major financial market asset classes; Forex, stock induces, bond markets, commodities, etc. Technical analysis of the financial markets can be employed across different assets and also, critically across different time frames.
The technical analysis trading approach is, therefore, very popular with all different types of investors and traders. Not only is technical analysis applicable across most asset classes and investable/tradeable products, but it can also be employed to analyse markets in the very, very short-term, through the intermediate-term, out to the very long-term.
How Does Technical Analysis Work & Why is it Important?
Technical analysis works because the various patterns that are formed with this approach are based on underlying psychological and behavioural approach to markets. The price action that defines the various technical analysis patterns is a reflection of all of the macroeconomic, microeconomic, fundamental and geopolitical events that have impacted markets.
The price action and the technical analysis patterns also encompass the thoughts, feelings, views and behaviours of the market participants. With human emotions and behaviours being somewhat constant over time, this means that the price patterns tend to repeat themselves.
For example, if a war breaks out the natural assumption would be that this would be a negative event for the markets. But it is the reaction of the all of the traders and investors to this news that is important. What if the war breaking out was expected? Then the investors and traders may (and in this case often do) react positively. This could be because although the war breaking out is negative in itself, the fact that the war has finally begun, adds some certainty and markets often take the certainty as a positive development.
Technical analysis is important because it allows traders to take advantage of the various patterns and tools to produce profitable trades. Because it is rules bases, it means that you as a beginner do not need to learn everything about markets to be able to trade. Technical analysis provides a structure where you as a trader can build a consistent and rewarding strategy.
Technical Analysis Examples
There are many different approaches to technical analysis that we will look at as we guide you through the world of charting.
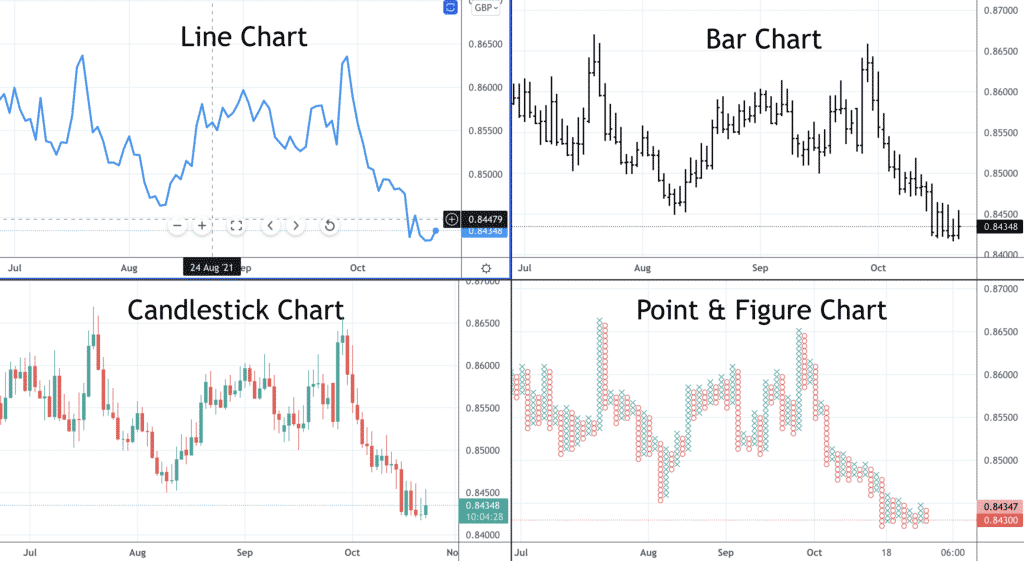
There are different types of technical analysis charts which we will look at in the next lesson, including bar charts, candlestick charts, line charts, Heiken Ashi charts, Renko charts, tick charts among many others.
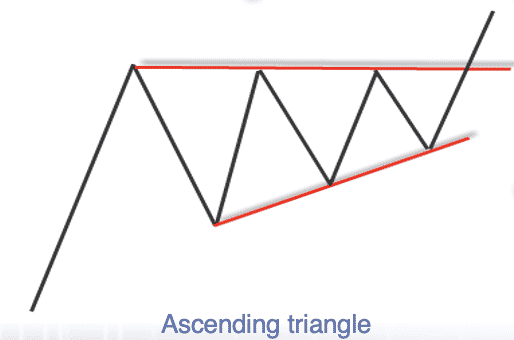
Different technical analysis patterns can broadly be split into continuation patterns (when the price continues in the same direction as it was before the pattern) and reversal patterns (when the price trend changes direction from the trend before the pattern).
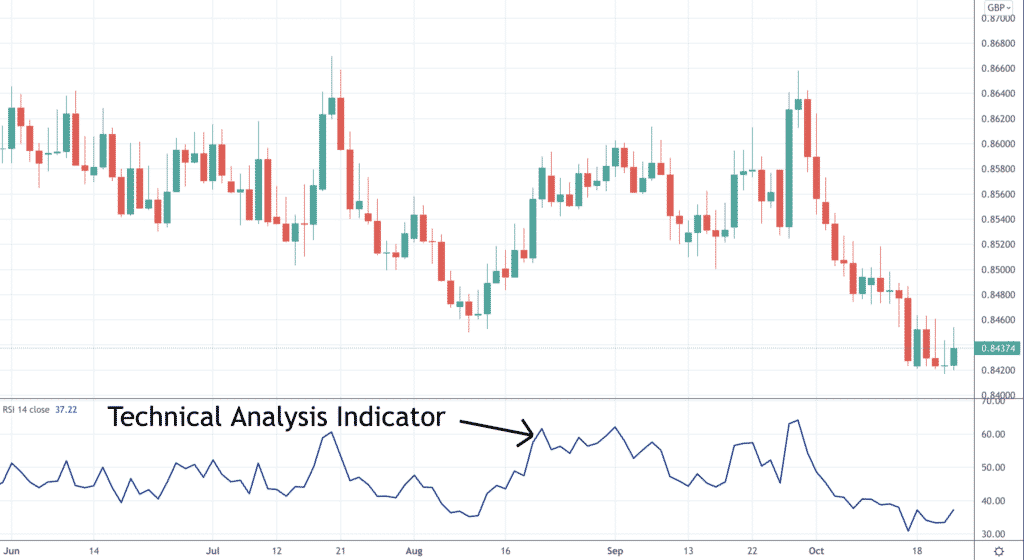
Furthermore, there is a whole area of technical analysis dedicated to technical analysis indicators and oscillators. Technical analysis indicators and oscillators are calculations based on inputs from the market price, shown on the chart. The inputs could include price (the open, the close, the low, the high), time and trading volume. These technical analysis indicators and oscillators can be displayed either on or below the price chart.
When Should Technical Analysis Be Used?
Technical analysis can be used across many, in fact most, major financial markets and asset classes. So, we can conduct forex technical analysis, analysis on stock indices, on individual shares, and apply technical analysis to commodity markets and more. You could argue that it is possible to perform technical analysis on anything that has a moving price, for example house prices, or the value of a famous painting.
Technical analysis can be applied to practically any time frame of trading or investing. As long as there is access to a reliable price data over time, and as long as the markets we are looking to analyse are liquid (which means that the assets can be easily bought or sold), then it is possible to use technical analysis as an approach to predicting market prices.
Technical analysis has for centuries, been used for long-term investing over months and years and for short-term trading over days and weeks. In the modern era with automation and computers, the latest technical analysis methods are used in high-frequency trading on sub-second time intervals.
The only situations where technical analysis may not be appropriate would be if the market is illiquid, or if there are only a very few buyers or sellers involved in a market (where the market price could be manipulated or controlled), or on very low-priced assets, such as penny stocks.
Technical Analysis Advantages
One of the frequently asked questions to any veteran technical analyst is, does technical analysis work? The short answer to that is yes!
Here are the main advantages of using technical analysis as a trading approach.
• Traders have shown that technical analysis works: Countless traders have proven that this form of market analysis is effective and is a successful approach to trading and investing that achieves consistent profits
• Technical analysis is rule based: It provides a clear framework for you to place a trade or enter an investment. It can help you to decide on the buying and selling levels, which can easily be defined using the rule-based technical analysis approach
• Technical analysis allows you to remove emotions: The structure that this market analysis approach provides, should allow you to be able to remove emotions that can be damaging to your trading success (at least partially).
• Technical analysis is relatively simple: It can be learnt and understood relatively easily compared to some of the more complex forms of market analysis
• Charting can be employed across numerous timeframes, as we have highlighted above
Technical Analysis Limitations
So, what are the limitations and the potential hurdles to overcome when using and trading with technical analysis?
As already mentioned, technical analysis is not suited to all markets and all situations.
Markets that would NOT be appropriate would be
• Illiquid markets
• Markets dominated by a small number of participants
These are often not conducive to the technical analysis approach.
One of the major criticisms of using technical analysis of the financial markets comes from the Efficient Markets Hypothesis (EMH) and in its weak form the Random Walk Hypotheses. These hypotheses contradict one of the fundamental principles of technical analysis, that past prices can predict future prices. Technical analysts, however, would rebuff this criticism, stating that EMH overlooks the behavioural aspects of trading and investing, that emotions, irrationality and thought errors all influence markets. This means that history does repeat itself, as human behaviours and emotions are at least somewhat constant over time.
In the next section of this course we will move you further forward into the world of technical analysis, with a look at trading charts.
You might also be interested in the myths about technical analysis.
