What are Breakouts (and Breakdowns)?
Support and resistance and the market reaction to breaking them are key concepts in technical analysis and trading. When the barriers that have been holding back the price are broken, it signals a change in the outlook for the market. A breakout signals an important next move for the price.
Breakouts can be either positive (on a move above an important resistance ) or negative (a move below important support). An Upside Breakout is a bullish signal for the price. A Downside Breakout (also known as a Downside Break, or a Breakdown) is a bearish signal.
Breakouts are also a crucial element of trading patterns in technical analysis.
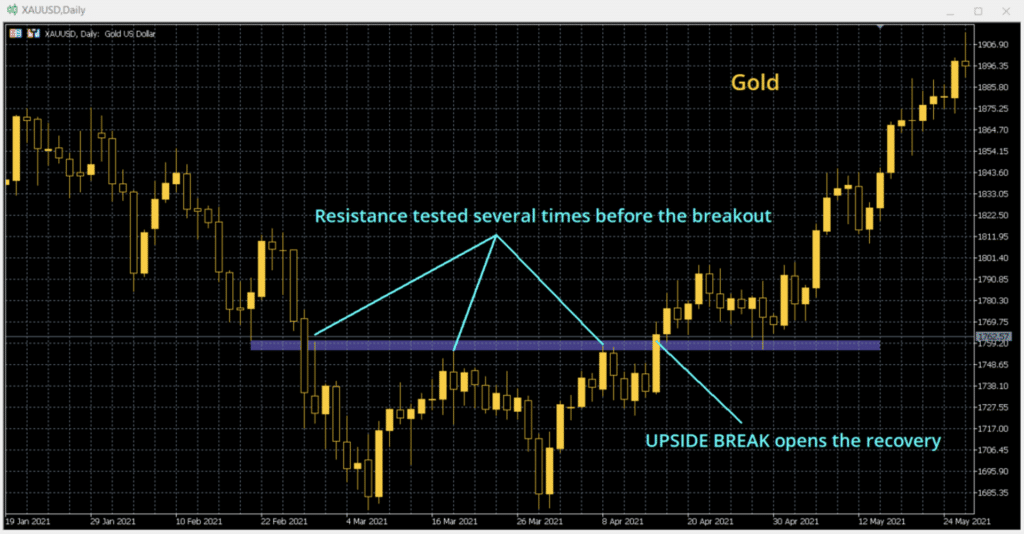
Upside Breaks
Markets can often test important resistance several times before an upside breakout. The more a level of resistance is tested before the breakout, the more important and decisive the breakout is likely to be. If an important resistance has been tested several times before finally breaking higher, this signals a new acceptance of the price at the higher level. This shift in sentiment opens the upside to further gains.
Old breakout levels can still be important gauges for the price. The upside breakout where “old resistance becomes new support” is an important concept in an uptrend. This aligns with the strategy of buying into weakness.
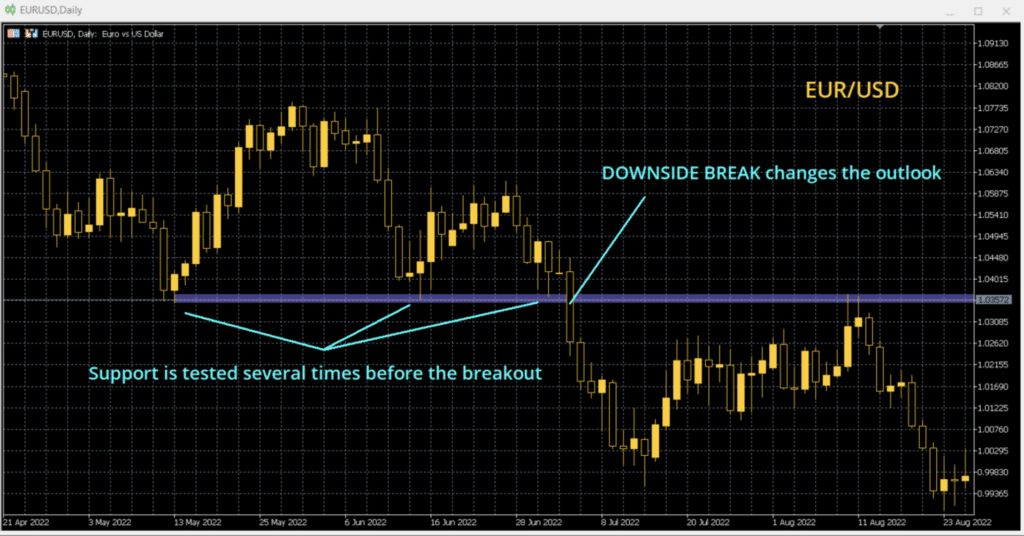
Downside Breaks (also known as Breakdowns)
The opposite of an Upside Break is, of course, a Downside Break. This is where important support is tested before being broken. The downside break opens the price to renewed selling pressure.
On the breakdown, the old important support level is still a key gauge for the market. Remember, “old support becomes new resistance” is a key concept for trading in a downtrend or bear market with a strategy of selling into strength.
Using technical indicators to confirm breakouts
Technical analysis traders can use some technical indicators to help determine the validity of a breakout:
- Volume: Volume is the classic signal for confirming a breakout. A move through key support or resistance will often come with large orders being triggered on the change of outlook. This should be reflected by an increase in volume on the break.
- Relative Strength Index (RSI): Momentum indicators can be a useful confirmation tool for breakouts. If a breakout is confirmed on indicators such as the RSI by a move to a new high, this can improve trading conviction for a breakout.
- Closing levels: Many technical traders will consider intraday breakouts to be unconfirmed. They would like to see a “closing breakout” where the market has had time to consider through the session and accept the move at the close of trading for the day. Waiting for closing confirmation on a breakout can add conviction for traders in the next move.
False breaks
Some breakouts will instantly reverse. This is known as a “False Breakout”. There are several reasons why this may occur:
- Support and resistance are subjective – not everyone acknowledges the same support and resistance levels. Subsequently, some levels will be more keenly watched than others. Volume can be a good indication of how important a level is. The higher the volume above normal levels, the more important the breaching of this support or resistance.
- The dark pools of the big traders – Some big traders will sit quietly in the market ready to hoover up the stop-losses of retail traders. The price can often turn sharply on these moves and ultimately results in a false breakout. Think of the whale shark, swimming serenely in the dark, with its mouth open and ready to trawl a shoal of fish.
