What is the “Head & Shoulders” pattern?
The “head and shoulders” is one of the most recognisable and famous price patterns in technical analysis. It is a pattern that signals a reversal in the price, with the formation of a new trend.
The patterns come with key characteristics:
- It has three identifiable peaks (for the head and shoulders top) or troughs (for the head and shoulders bottom).
- The pattern also has an identifiable “neckline” where the price continually reverts during the formation.
- The pattern completes when the price moves decisively through the neckline to drive a reversal of the prevailing trend.
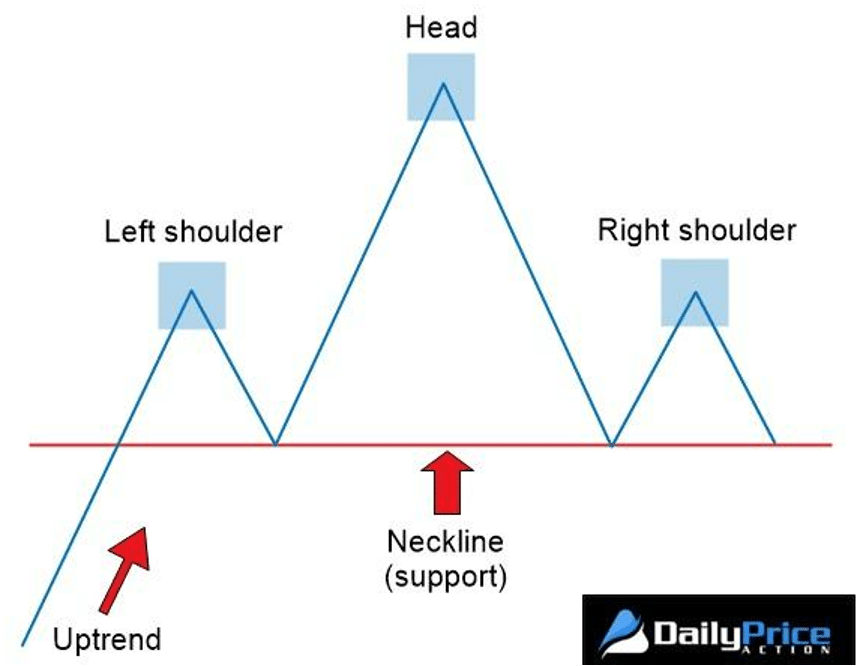
Head & Shoulders Top
The head and shoulders top comes after the price has been in a prevailing uptrend of higher lows and higher highs. Following the final highest peak in the price (the head) the market corrects back to the support of the previous low.
The price rebounds from the support, however, fails to break out to form a new high. Instead, the price falls away to leave a lower high (right-hand shoulder). The market is then on alert for a potential head and shoulders top.
The pattern is complete when the market falls below the support of what is now a “neckline” of lows around similar levels. Breaking the neckline support means that a new lower high and a lower low have formed a new downtrend that is corrective to the earlier uptrend.
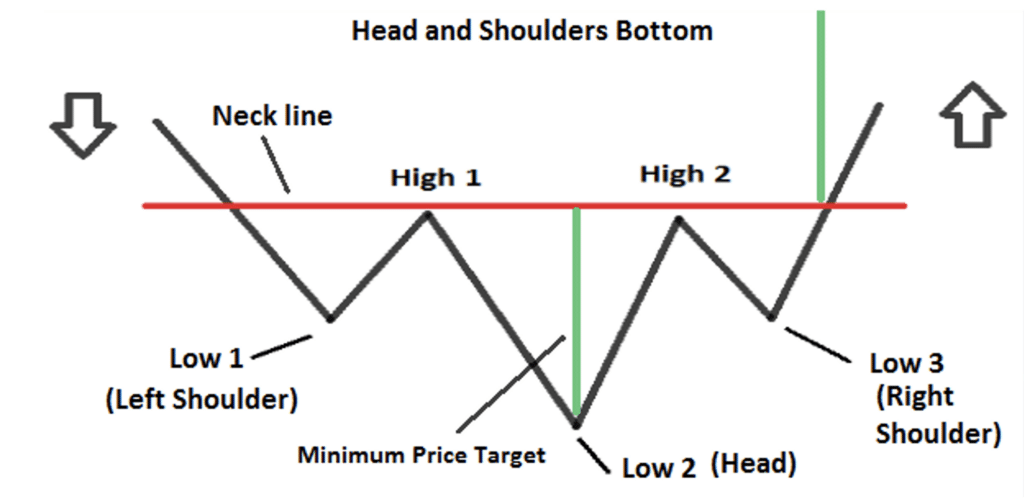
Head & shoulders bottom
Unsurprisingly, this is the opposite of a head and shoulders top pattern. The head and shoulders bottom develops after a downtrend in the price has formed a run of lower lows and lower highs.
The price rebounds from the lowest low (the head) and rallies towards the resistance of the latest key lower high. Although the price falls away, it quickly finds support to form a new higher low (the right-hand shoulder).
The pattern is complete as the price rallies through the “neckline” resistance of the previous rebound highs.
The concept of trend change and head & shoulders patterns
One of the key reasons why the head & shoulders patterns are so identifiable is that they perfectly illustrate the concept of trend change.
Dow Theory is the bedrock of technical analysis. Markets move in trends. An uptrend has higher highs and higher lows. A downtrend has lower highs and lower lows.
However, when the trend begins to reverse and change, the highs and lows of the market can begin to change.
- As an uptrend begins to change to a new downtrend, the market begins to post lower highs and lower lows. This begins to take the form of a head and shoulders top.
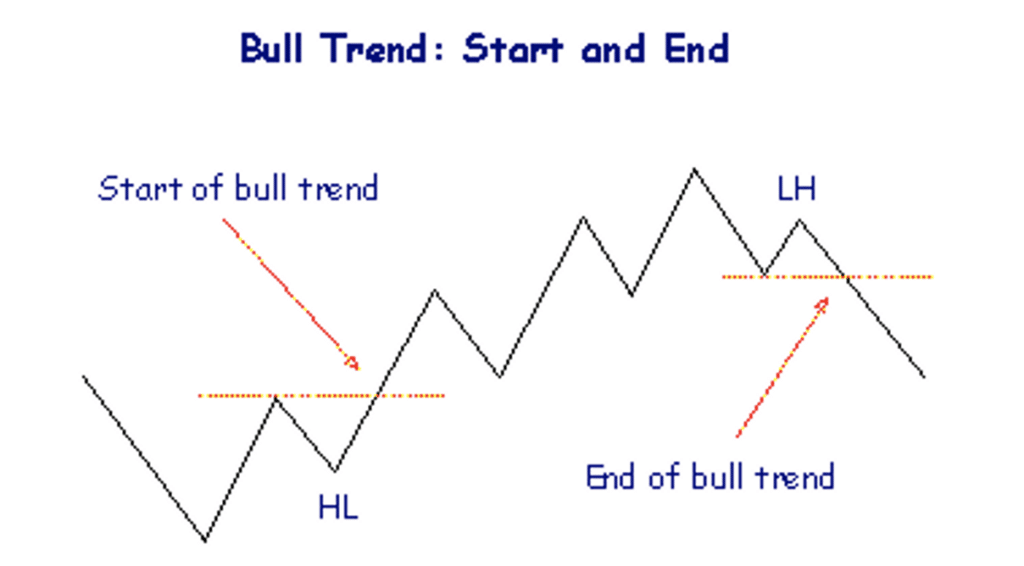
- As a downtrend begins to change into a new uptrend, the market begins to post higher lows and higher highs. This starts to develop into a head and shoulders bottom.
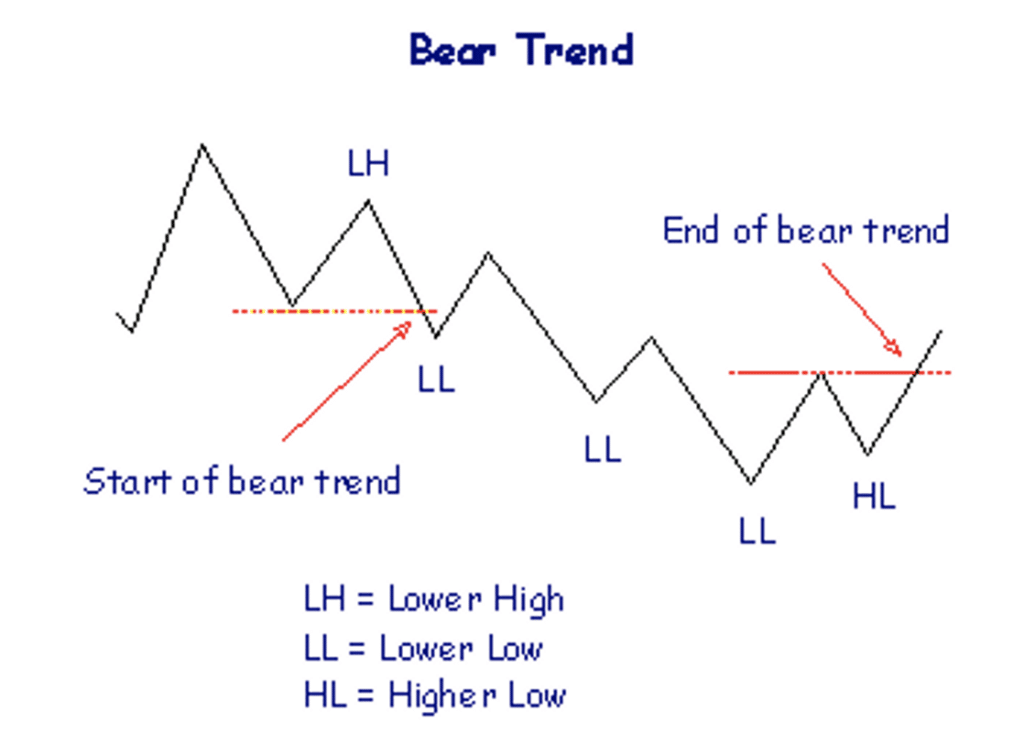
Whilst not all trend changes develop into classic head and shoulders reversal patterns, there are key characteristics that can be consistently seen in many of the reversal patterns.
Implied targets, pullbacks and stop-losses
One reason why head and shoulders patterns are popular is that they give traders implied levels for price targets and stop losses.
| H&S Top | Implied target | The height of the head is measured down to the neckline. This is projected lower from the breakdown point of the neckline. |
| Key resistance | Once the pattern is complete, the old support of the neckline becomes new resistance. | |
| Stop-loss | A move above the resistance of the right-hand shoulder. | |
| H&S Bottom | Implied target | The depth of the head measured up to the neckline. This is then projected higher from the breakout point of the neckline. |
| Key support | Once the pattern is complete, the old resistance of the neckline becomes new support. | |
| Stop-loss | A move below the support of the right-hand shoulder. |
Once the pattern has been completed there will often be a retest of the neckline. This is known as a “pullback”. This test can be an important confirmation of the pattern.
For example, with a head and shoulders top, if the neckline acts as new resistance this helps to validate the pattern. It also gives traders another chance to trade the pattern.
Imperfect patterns
Head and shoulders patterns will rarely have the perfect formation of a flat neckline and uniform shoulders. Necklines are often sloping and the shoulders will vary in magnitude.
That will mean that some adjustment to the pattern completion point is required. This can also impact potential price targets.
For example, an upward-sloping neckline of a head and shoulders top requires a move below the support of the left-hand shoulder for conservative confirmation.
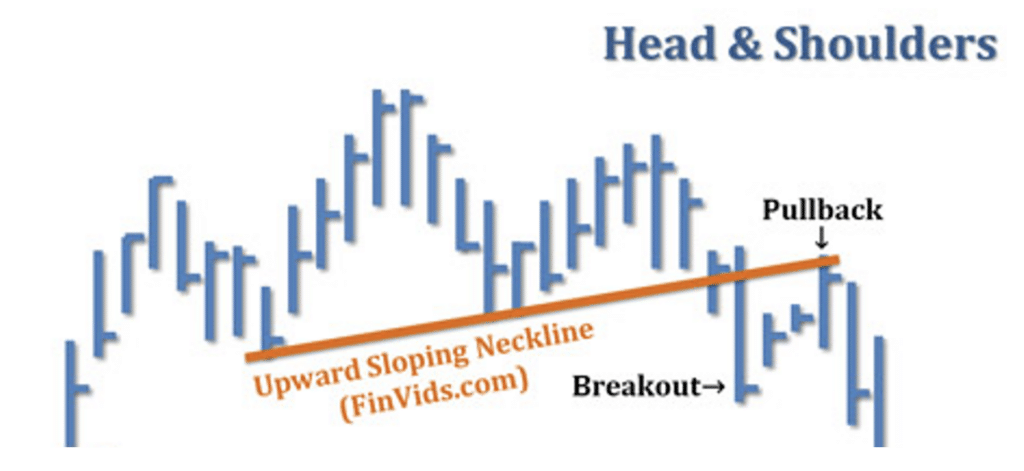
The implied target is then measured from the point where the neckline is first broken. Therefore the target will be somewhat smaller than with classic head and shoulders top patterns.
