What is a moving average?
A moving average is a smoothed line on a price chart that illustrates how price has moved over time. It takes an average of prices over a specific period. A 20-day moving average will take the average price over the last 20 days. A 20-hour moving average will be an average of the past 20 hours. Both would use the latest price and the previous 19 close prices of the time frame.
Moving averages are used to remove the noise that can come with volatile moves in the price. They can help to determine the trend of a price. As such, they can be used as indicators of support and resistance but also trend reversals too.
The different types
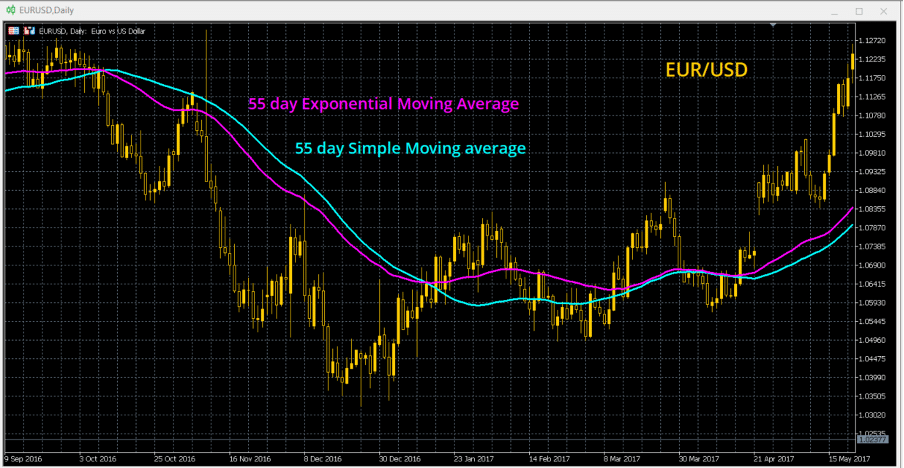
Various calculations can be used to determine a moving average. The most basic and popular measure is the Simple Moving Average (SMA). This takes the price for each period in the data set and divides it by the number of periods.
However, the SMA will give equal weighting to data that in some cases was weeks ago and may not be so relevant now. An Exponential Moving Average (EMA) looks to remove this by giving bias to the most recent data in the calculation. This makes it s more sensitive moving average than the SMA.
There are positives to the EMA versus the SMA. The EMA has a quicker reaction to price moves and can generate more signals. However, the quicker reaction of the EMA can also give rise to potentially false signals too. More investigation should be done before deciding which methodology to use.
How long moving averages to use?
Using a variety of lengths of moving average will give a different indication of the short, medium or longer-term outlook for a market. When using daily moving averages, traders will often use a combination of moving averages.
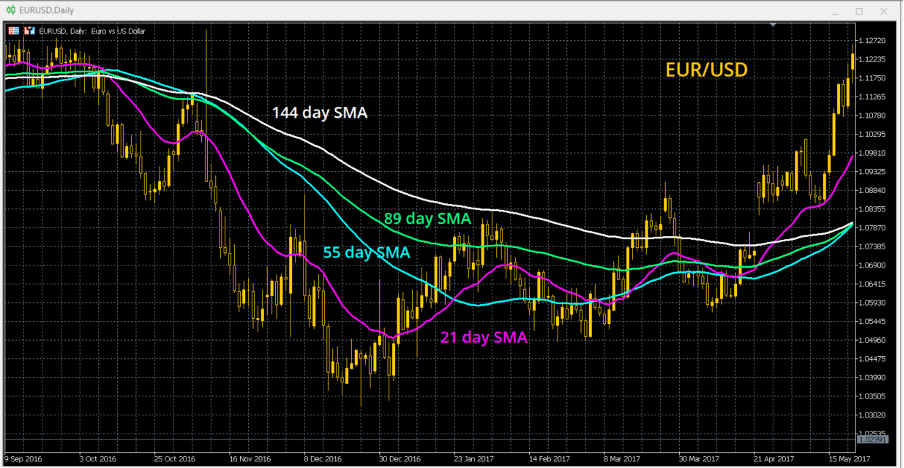
Traders will often use round numbers to calculate moving averages. Some will go further and use Fibonacci numbers in their calculation of moving averages. Here is a list of popular moving averages (ma):
- 20-day ma (or 21-day if using Fibonacci). This is about four weeks or one month’s worth of trading data. This gives a good short-term outlook.
- 50-day ma (or 55 day ma for Fibonacci). This is closer to three months of data, or a medium-term outlook.
- 90 or 100-day ma (or 89-day ma for Fibonacci traders) is also often used.
- 200-day ma (144-day ma is often used as the longer-term Fibonacci number). This is used to indicate the long-term outlook for trading.
Moving averages can work on any chart, from minutes up to weekly or even monthly. As ever with technical analysis, the longer term the signal, the higher the trading conviction.
Trading with moving averages
Traders can use moving averages to generate signals but also for confirmation. Here are a few ways:
- Price movement compared to a moving average: If a price is rising above a rising moving average, it is considered to be a bullish move. A price falling below a falling moving average is bearish.
- Moving averages as support or resistance: A moving average is seen as an illustration of a trend in the price. As such they often become strong gauges for support and resistance. A rising moving average can be used as support for corrections in a bull market. A falling moving average can be resistance in a bear market.
- Moving average crossovers: If two moving averages of different lengths cross each other it can generate signals. A “Golden Cross” is a bullish signal and comes as two rising moving averages cross over. A “Death Cross” is a bearish signal where two falling moving averages cross.
Other technical indicators that use moving averages
Some technical analysis indicators use the concept of moving averages as part of their calculation. Here are some of the more popular ones:
- Moving Average Convergence/Divergence (MACD) – The clue is in the name. The MACD uses the relative positioning of two EMAs to generate trading signals.
- Bollinger Bands – The classic form of Bollinger Bands use the standard deviation around a 20-period moving average for its calculation.
