Trading indicators are mathematical calculations (or algorithms) usually based on three inputs; price, volume and time, as we introduced in more depth in part 1. This article will build on the prior lesson, so you should make sure you have checked out part 1 first.
How Many Types Of Trading Indicator are there?
There are countless trading indicators, with individual traders and analysts adding to the number on a daily basis. However, there are a number that are used globally by many traders, that have been shown to be useful over many years, and we are going to focus on these to help you with your trading.
What Category Do These Trading Indicators Fall Into?
As we highlighted in What Are Trading Indicators? Part 1, There are a number of differing categories of trading indicators. These are:
- Trend indicators
- Momentum indicators
- Volatility indicators
- Volume indicators
- Moving Averages
- Channel
Here we categorise many of the more important trading indicators.
| Indicator Categories | |||||
| Trend | Momentum | Volatility | Volume | Moving Averages | Channel |
| MACD | Stochastics | Average True Range (ATR) | Accumulation Distribution Line | MACD | Bollinger Bands |
| Parabolic SAR | MACD | Average True Range with Percent (ATRV) | Negative Volume Index | Donchian Channel | Donchian Channel |
| Average Directional Index (ADX) | Relative Strength Index (RSI) | Adaptive Price Zone | Positive Volume Index | Simple/ Arithmetic Moving Average | Bollinger Bandwith |
| Directional Movement Index (DMI) | Awesome Oscillators | Chaikin Volatility | On Balance Volume | Exponential Moving Average | Bollinger Percent |
| Falling Three Methods | Commodity Channel Index (CCI) | Bollinger Bandwith | Trade Volume Index | Weighted Moving Average | Keltner Bands |
| Rising Three Methods | Williams %R | Bollinger Percent | Traders Dynamic Index | Alligator | Keltner Channel |
| Aroon Oscillator | Ichimoku Cloud Bounce | Standard Deviation | Volume ROC | Bb MACD | Linear Regression Forecast |
| Ichimoku Cloud Bounce | Awesome Oscillator | Volume Oscillator | Centre of Gravity | Linear Regression Intercept | |
| Balance Of Power | CMO | Volume Weighted Moving Average | High Low Bands | Linear Regression Squared | |
| Darvas Box | Disparity Index | Stoller Average Range Channel Bands (STARC Bands) | Hull Moving Average | Linear Regression Sloped | |
| Demark Trend Line | Money Flow Index | Kaufman Adaptive Moving Average | Standard Deviation | ||
| Elliot Wave Oscillator | Price ROC | Keltner Bands | Stoller Average Range Channel Bands (STARC Bands) | ||
| Ergodic Oscillator | Price Oscillator | Moving Average Envelope | Equidistant Channel | ||
| Fisher Transfrom | Stochastic Momentum Index | Osma | |||
| Hilo Activator | TRIX | Stochastic Double Smoothed | |||
| Kaufman Efficiency Ratio | True Strength Index | Tillman T3 | |||
| Mass Index | Time Series Moving Average | ||||
| Pivot Points | Traders Dynamic Index | ||||
| Range Expansion Index | Triangular Moving Average | ||||
| Schaff Trend Cycle | Variable Moving Average | ||||
| Sine Wave | Vidya Moving Average | ||||
| Spearman Correlation Coefficient | Volume Weighted Moving Average | ||||
| Super Trend | |||||
| Trend Adjusted Oscillator | |||||
| Trend Strength Index | |||||
| Zigzag | |||||
What are the Most Commonly Used Trading Indicators?
The most commonly used trading indicators are; Moving Average Convergence Divergence (MACD), Relative Strength Index (RSI) and Stochastics.
However, there are also some other indicators that are also used widely, which would include Bollinger Bands, Directional Movement Index (DMI), Parabolic SAR (SAR), Pivot Points, Average True Range (ATR) and the Commodity Channel Index (CCI).
We will look at all of these in turn.
Moving Average Convergence Divergence (MACD)
Moving Average Convergence Divergence (usually shortened to MACD and pronounced Mac-Dee) is a trend indicator but can also be categorised as a momentum or moving average indicator too. MACD is based upon two moving averages and can indicate a new trend either bullish ot bearish. This is obviously important, because as the markets saying goes “the trend is your friend”.
There are three inputs to calculating the MACD; the first two inputs are for two moving averages of the price, the third is a moving average of the difference, between the first two moving averages. These are plotted below the chart as two lines. One line is the difference between the two moving averages and the second line is the moving average of this first line. Sometimes, a histogram, or bar chart is also plotted, which shows the difference between the two lines. You can see this in the image here.
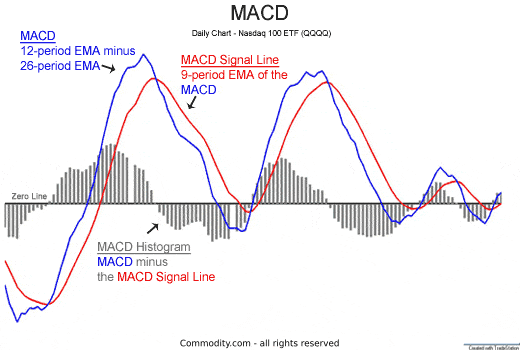
It sounds complicated, but the main takeaways for your trading are these:
- As the two lines converge and then crossover, the histogram goes to zero and this can be a sign of one trend ending and another trend starting in the opposite direction.
- If the two significantly lines diverge, then the histogram gets bigger and this can be a sign of the current trend starting to be stretched, either overbought for a bull trend or oversold for a bear trend.
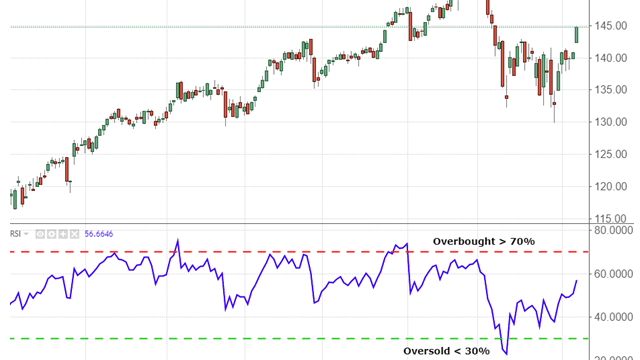
Relative Strength Index (RSI)
The Relative Strength Index is better known as just its acronym, RSI and is a very popular and widely used momentum indicator developed by the famous technical analyst, Welles Wilder.
RSI key takeaways
- It is plotted below the chart on a scale of 0-100.
- It is primarily a measure of how stretched a market is, either oversold or overbought.
- Generally speaking, if the RSI falls below the 30 level, it is considered oversold.
- Above 70 would signal that the market is overbought.
- Some interpretations of reading the RSI say that it is only when the RSI enters into and then comes back from the overbought and oversold levels (for example above 70 and then back below 70, or down below 30 and then back above) that the trend has shifted direction.
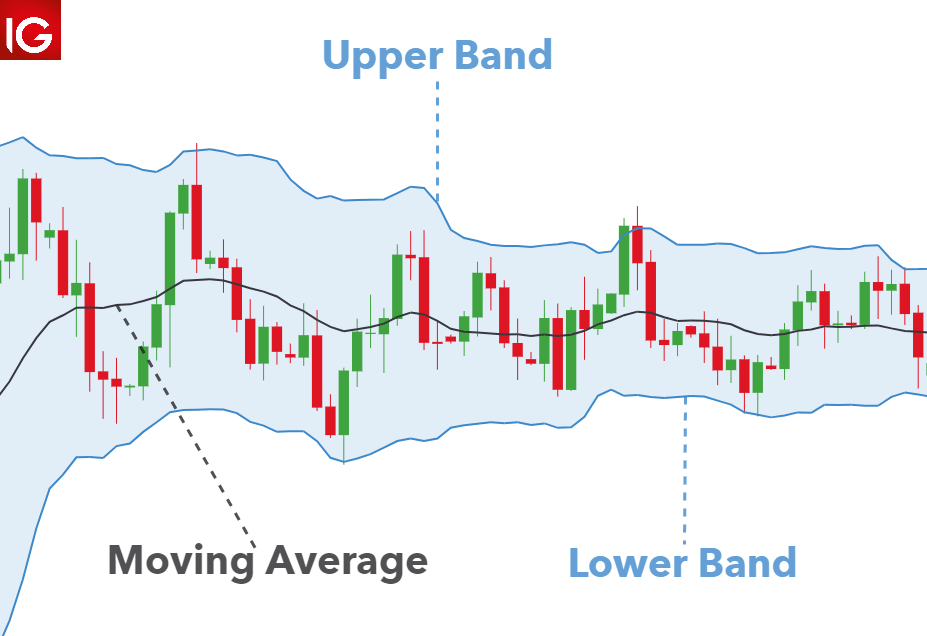
Bollinger Bands
Bollinger Bands are a channel indicator and you can see more about Bollinger Bands in our article What are Trading Channels?. Bollinger Bands are a set of price channels or envelopes around a simple moving average, plotted two standard deviations above and below the simple moving average.
The main two takeaways for your trading are:
- Bollinger Bands can indicate when a market is stretched in one direction; oversold in a bear trend, overbought in a bull trend.
- The Bollinger Band “squeeze” can indicate potential for an impending breakout. For more information visit What are Trading Channels?.
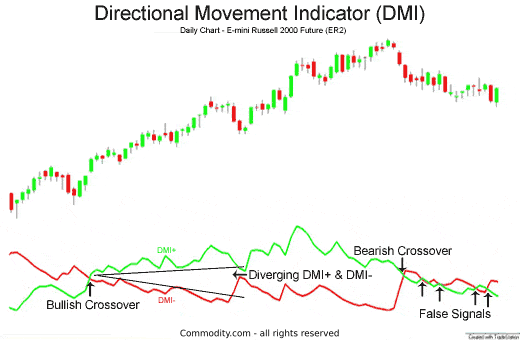
Directional Movement Index (DMI)
The Directional Movement Index (DMI) was also created by Welles Wilder and is a trend indicator. The indicator has two lines, the positive directional movement line (+DI) and the negative directional movement line (-DI), which are derived comparing previous highs and lows.
When +DI is above -DI the market is showing a more positive trend and when +DI is below the -DI the market is showing a more negative trend. The wider the apart are +DI and -DI, the strong er the trend. When these two lines crossover, therefore, it can be a signal that trend is shifting direction.
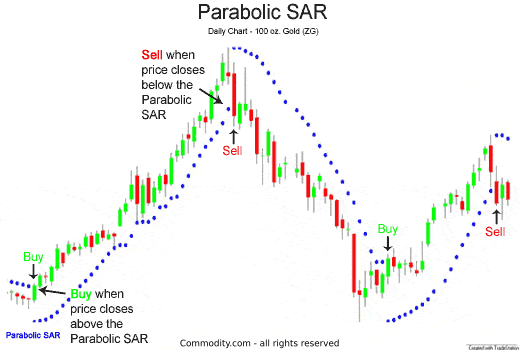
Parabolic SAR (Stop and Reverse)
The Parabolic SAR or just SAR (where SAR stands for Stop and Reverse) is a trend indicator and is mainly used to signal when a trend ends. The SAR is shown on the charts as a series of dots above or below the current market price.
When the dots are below the current price the signal is for an up trend and when the dots are above the current price it signals a down trend. So, this tool is clearly best used when a market is trending.
The best use of the tool is probably to exit trades, when the dots move from one side of the current price to the other, signalling that the trend may be over.
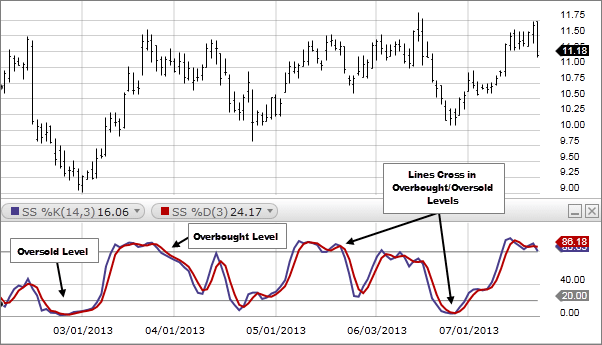
Stochastics
The Stochastic is a momentum indicator that can also be used to signal the potential end to market direction, but rather than best used in a trending phase, the Stochastic is best suited to when a market is in a non-trend, or range.
Stochastic key takeaways
- It is plotted as two lines below the chart on a scale of 0-100.
- It is primarily a measure of how stretched a market is when in a range environment.
- Above 80 would signal that the market is overbought and below 20 oversold.
- If the two lines crossover above 80 it gives a sell signal and if they crossover below 20 a buy signal is given.
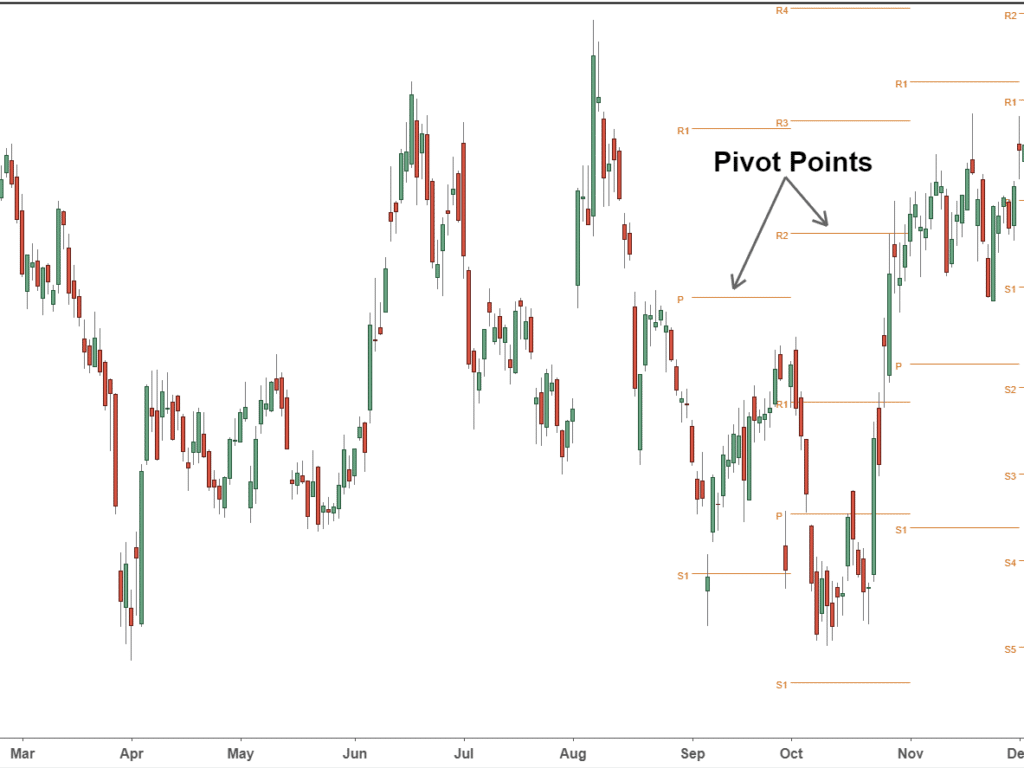
Pivot Points
Pivot Points can be viewed as a trend indicator and we have covered these in depth in our article What Is Support & Resistance In Trading?.
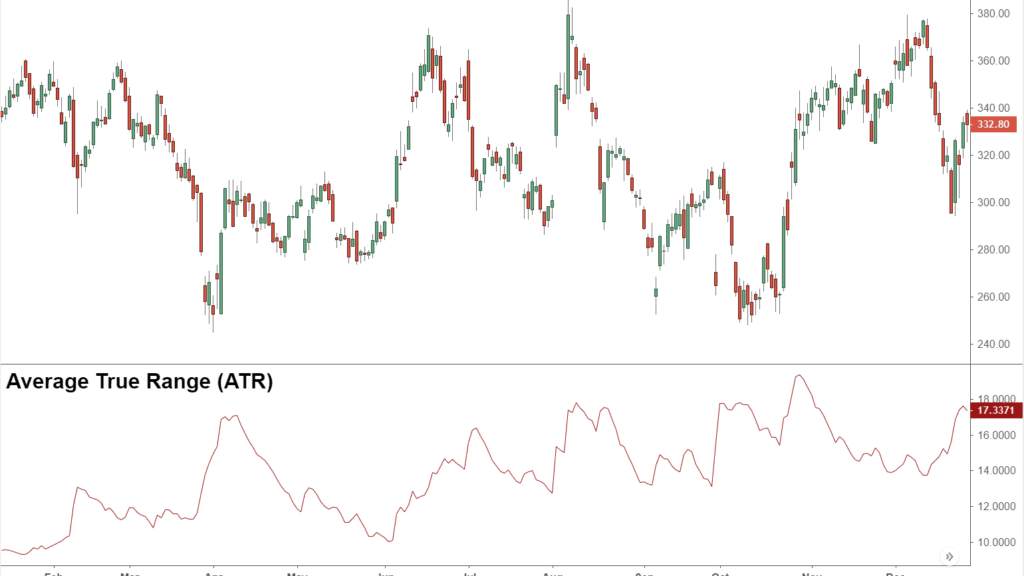
Average True Range (ATR)
The Average True Range is a volatility indicator (shortened to ATR) and again was developed by Welles Wilder. Usually it is a calculated from the 14-day moving average of the True Range, which is the greatest of:
- Current High less the current Low
- Current High less the previous Close (absolute value)
- Current Low less the previous Close (absolute value)
It is best used to reflect when markets are becoming more volatile, a higher or rising ATR would signal a market that is seeing increased volatility. This may cause you to adjust your trading strategy accordingly.
It can also be useful by swing, position and day traders for setting realistic price targets for trades.
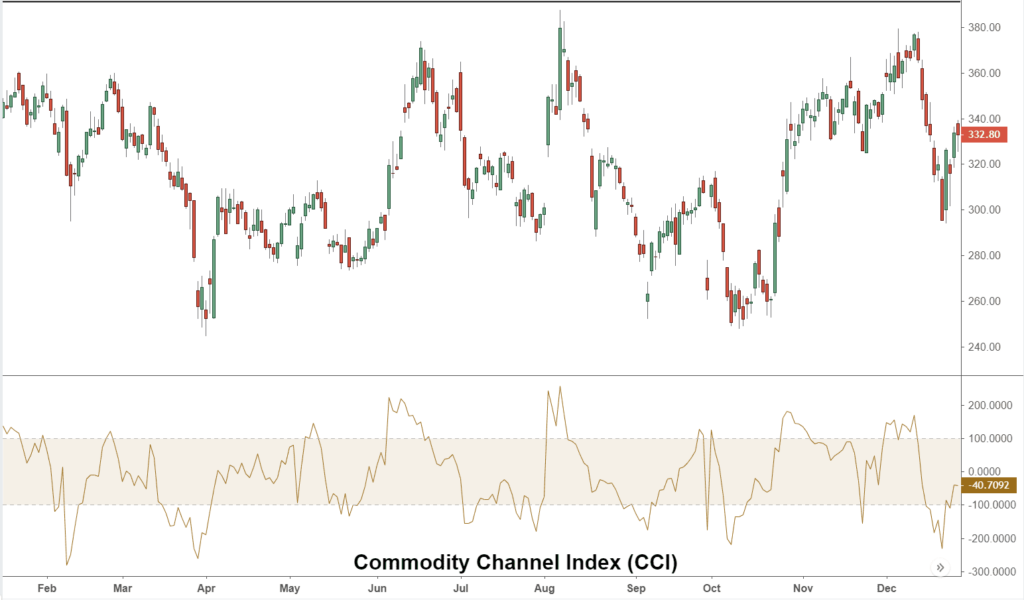
Commodity Channel Index (CCI)
The Commodity Channel Index (or CCI) is another momentum indicator that best helps in identifying when a market is overstretched (overbought or oversold). In addition, the CCI can also be used to indicate trend force and direction. In simple terms it is a calculation of how much the current price is deviating from the average price over a time frame (with 20 periods most commonly used).
As the indicator has no upper or lower boundaries, overstretched conditions have to be viewed in a historical context. This means looking back at previous indicator readings to get a feel of when price reversed direction.
If the CCI moves from zero to above +100 this can be seen as a up trend forming and from zero to below -100 is viewed as a down trend forming.
Trading Indicators Summary
This article has built on What Are Trading Indicators? Part 1 and we have progressed to look at how many types of trading indicator there are and the categories these trading indicators fall into. In addition, we have looked more closely at the most commonly used trading indicators and how you can use these to better your trading strategy and most importantly your trading results.
This should now enable you to go and use these indicators in your trading strategies.
To keep learning and increase your trading knowledge check out What are Trading Channels?.
