Welcome to the dynamic world of investing, where understanding the nuances of data visualisation can be the key to unlocking profitable opportunities. In this fast-paced financial landscape, being able to decipher trends quickly is crucial. One such tool that empowers investors with insightful visualisations is the hockey stick chart, a type of line chart. So, grab your seat as we take a thrilling skate through the fascinating realm of hockey stick charts, revealing how they can be your trusted guide in the world of investments.
- What are Hockey Stick Charts?
- How Hockey Stick Charts Work
- Interpretation of Hockey Stick Charts
- Applications in Investing
- Advantages of Hockey Stick Charts
- Limitations and Considerations
- Tips for Reading Hockey Stick Charts
- Final Thoughts on Hockey Stick Charts
What are Hockey Stick Charts?
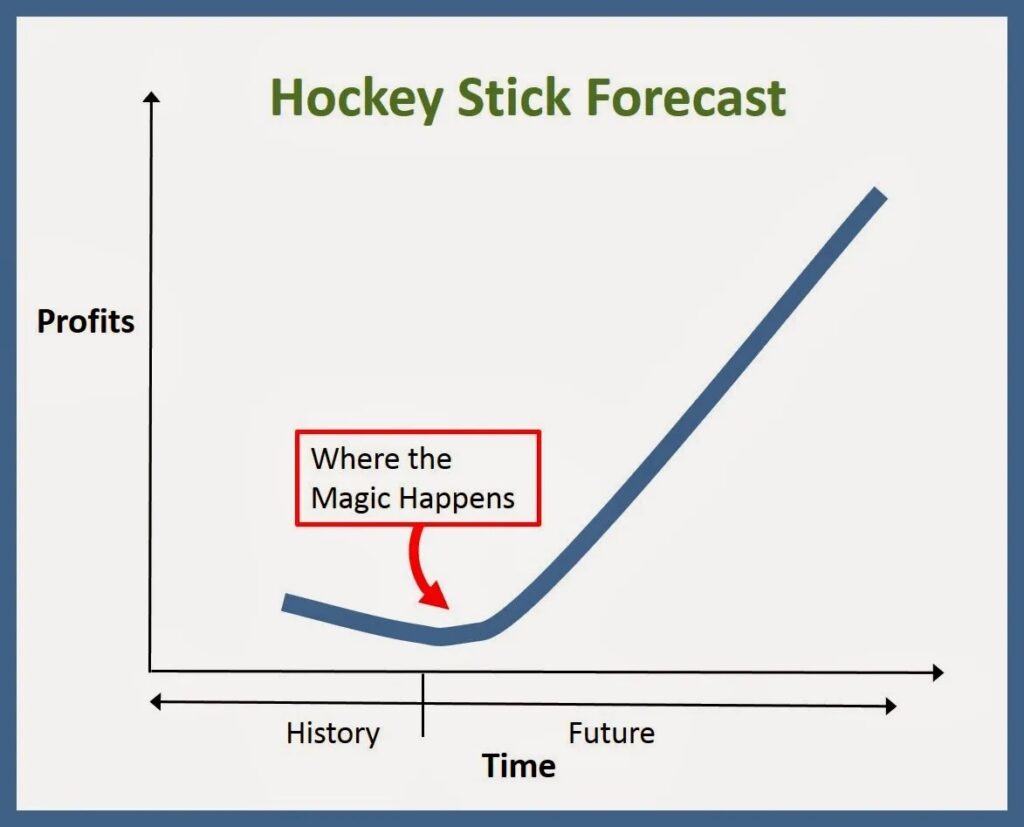
A hockey stick chart is defined as a graph that starts with a gentle incline, resembling the blade of a hockey stick, and then suddenly shoots upward, mirroring the stick’s distinctive curve. These are hockey stick charts – a visual representation of data that holds the potential to transform the way you analyse investment trends. Think of it as a financial storyteller, narrating the journey of an investment from its modest beginnings to a potential grand slam.
How Hockey Stick Charts Work
Now, let’s break the ice on how these charts actually work. Imagine the x-axis as a timeline, tracing the progress of your investment over days, months, or years. On the y-axis, you’ll find the value of your investment. In the early stages, the line slopes gradually – that’s the setup. Then, the magic happens: a sudden, upward spike, signalling accelerated growth or profit. It’s like the thrilling climax of a hockey game where a winning goal takes everyone by surprise.
Hockey stick charts, much like the game they’re named after, are all about strategy, anticipation, and that exhilarating moment when everything falls into place.
Interpretation of Hockey Stick Charts
Now that we’ve got a glimpse of what hockey stick charts look like, let’s unravel the mystery of interpreting them. The gradual slope represents the initial stages of an investment, akin to the preparation phase in a game. It’s where the groundwork is laid. Then, the sudden upward spike is the defining moment, akin to the triumphant goal in a hockey match. This spike signifies accelerated growth or profit, a game-changer for investors. Understanding these components is like reading the play-by-play of a thrilling financial game, giving you insights into the potential success of your chosen investments.
Applications in Investing
So, how do savvy investors make the most of hockey stick charts? They’re not just colourful lines on a graph; they’re powerful tools for decision-making. Investors use these charts to spot trends, identify growth opportunities, and make informed choices. Picture them as the coach’s playbook, guiding you through the twists and turns of the market game. Successful investments often have their stories written in the lines of a hockey stick chart, showing how strategic planning and timing can lead to winning outcomes.
Advantages of Hockey Stick Charts
What gives hockey stick charts an edge in the investment game? Clarity. These charts offer a clear and visual representation of trends, helping you make sense of complex data at a glance. The early identification of potential opportunities is a game-changer, allowing investors to position themselves strategically. Furthermore, they play a crucial role in risk management, providing a visual cue when a planned investment strategy may need adjusting. In the fast-paced world of investments, having a visual ally like the hockey stick chart can be the difference between a routine play and a winning move.
Limitations and Considerations
While hockey stick charts can be a valuable asset, it’s essential to acknowledge their limitations. One key consideration is the potential for misinterpretation. The excitement of a sudden upward spike might overshadow the need for a comprehensive analysis. Investors must be cautious not to rely solely on the chart, recognizing the importance of considering external factors that might impact the investment landscape. Additionally, market volatility and unforeseen events can throw a curveball, reminding us that no chart is a crystal ball. As with any tool, it’s essential to use hockey stick charts judiciously and in conjunction with other analytical methods for a well-rounded perspective.
Tips for Reading Hockey Stick Charts
Now, let’s equip you with some insider tips for mastering the art of reading hockey stick charts. First and foremost, context is king. Understand the broader economic landscape, industry trends, and specific factors influencing your chosen investment. Don’t skate on thin ice by relying solely on the chart; use it as a supplement to your overall strategy. Consider incorporating additional tools and indicators to enhance your analytical prowess. And remember, like any skill, reading hockey stick charts improves with practice.
Final Thoughts on Hockey Stick Charts
In the exhilarating game of investing, hockey stick charts emerge as star players, providing investors with a visual narrative that transcends traditional data analysis. As we’ve glided through the definition, workings, interpretation, and applications of these charts, it’s clear that they are more than just lines on a graph. They’re strategic allies, revealing the potential trajectory of your investments.
So, as you venture into the financial arena, armed with the knowledge of hockey stick charts, remember to keep cautious. Acknowledge their limitations, heed our tips for reading them effectively, and always complement them with a comprehensive strategy. The financial game is dynamic, but with hockey stick charts as your playbook, you’re better positioned to make winning moves.
