Candlestick patterns in trading are a way of looking at price action in a different way to the line, bar or OHLC charts we looked at in our article on types of charts.
Candlestick patterns have a long and ancient history dating back to 18th Century Japan. They were developed by Munehisa Homma, who was a rice merchant trading on the rice futures exchanges in Osaka, Japan. He was one of the most successful traders of all time and amassed a fortune estimated in today’s value to be $100 billion. He wrote various books on the psychology of trading including The Fountain of Gold – the Three Monkey Record of Money. The candlestick patterns that he identified enabled him to make successful decisions about the future price of rice. They have been used by traders ever since to pinpoint changes in price direction. They are often also called Japanese candlestick charts.
How do Candlesticks Work?
Candlestick patterns work by displaying the price action in any time period in a slightly different way to what we have examined previously with bar charts or OHLC charts. We’ll look at this different construction below, but the important thing for you to remember is that the candlestick patterns reflect the shifting of market psychology. Munehisa Homma identified that the different types of candlestick patterns echoed the emotions and behaviors of the rice traders, if they were shifting from bearish to bullish or bullish to bearish. If you are able to identify these shifts in the candlesticks then you’ll have an advantage in your trading.
How to Read Candlestick Charts
Candlestick patterns and charts can be applied to any time frame. They are similar to normal bar or OHLC charts, in that the main four pieces of price data are represented; that is the high and low, plus the open and close (for the time period). The candlesticks look different, however, because the area between the open and close is wider than the area up to the high and down to the low. This can best be seen in the image below.
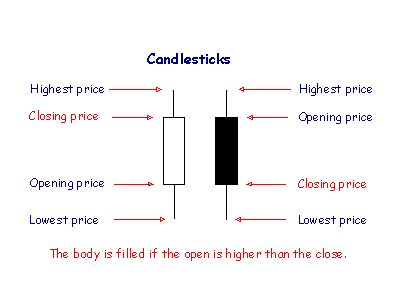
The wide area between the open and close is known as the real body, whilst the thin lines above and below the real body are known as the shadows. The upper shadow is often referred to as the wick, while the lower shadow is often described as the tail. The shadows represent the extremes of the move for the time period, the top of the wick is the high and the bottom of the tail is the low.
Traditionally, if the asset price closes higher than it opened, the real body would be left hollow or not filled. If the market price closed below the open, then the real body would be filled, or solid. Today though, you’d often see white or green candlesticks for “up” candles and black or red candle bodies for “down” candlesticks.
We’d like to stress, that of critical importance when reading the different candlesticks is the lengths of the real body, the wicks and the tails in relation to each other. Plus, of course the direction of the candlestick. It is how these different elements of the candlestick combine that gives us the different candlestick patterns.
Why are Candlestick Patterns Important?
Candlestick patterns are important as they show more information to you than bar charts or OHLC charts can. Because of the different shapes constructed by the real body and the shadows (the wicks and the tails), it is possible for you to identify whether the market is likely to continue in the current direction, or more importantly about to reverse in the opposite direction.
How Many Candlestick Patterns Are There?
There are many different types of candlestick patterns and the below list is not exhaustive:
- Bullish Engulfing Pattern
- · Bearish Engulfing Pattern
- · Dark Cloud Cover
- · Doji
- · Dragonfly Doji
- · Evening Star
- · Gravestone Doji
- · Hammer
- · Hanging Man
- · Harami
- · Inverted Hammer
- · Morning Star
- · Piercing Pattern
- · Shooting Star
- · Tweezer Tops & Bottoms
- · Windows
- · Three White Soldiers
- · Three Black Crows
- · Spinning Top
What Are The Most Commonly Used Candlestick Patterns?
We’re going to explore some of the most commonly used and most useful patterns for you in your trading.
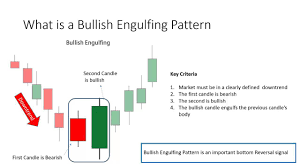
Bullish Engulfing Pattern
- A Bullish Engulfing pattern forms when the real body of a candlestick completely engulfs (or overlaps) the real body of the prior candlestick.
- The real body of the second, engulfing candle would be an “up” day, that is to say is hollow, not filled, white or green.
- Usually, but not always, the first candlestick body (then one that is being engulfed) would be a “down”, black or red body.
- In addition, the market would ideally have been in a short-term downtrend, then the Bullish Engulfing pattern would signal a reversal of the trend.
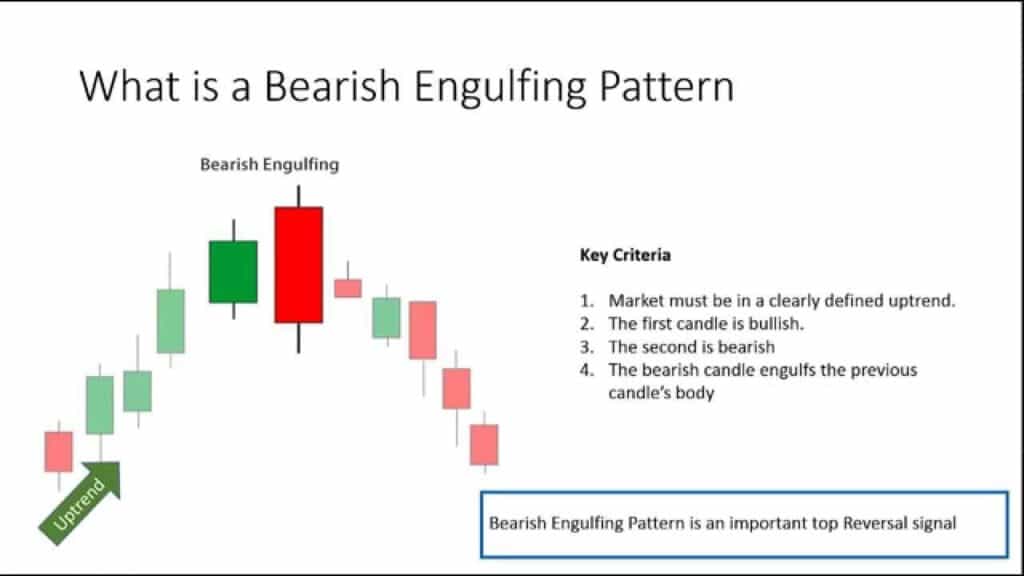
Bearish Engulfing Pattern
- As with the Bullish Engulfing pattern, the Bearish Engulfing pattern forms when the real body of a candlestick completely engulfs (or overlaps) the real body of the prior candlestick.
- In this case though you’d see real body of the second, engulfing candle as a“down” day, that is to say is filled in, is black or red.
- Usually, but not always, the first candlestick body (then one that is being engulfed) would be an “up”, white or green body.
- Ideally the market would have been in a short-term uptrend, then the Bearish Engulfing pattern would signal a reversal of the trend.
Doji Pattern
- Doji candlestick patterns occur when the open and close in a time period are at or near the same price.
- They appear as a cross, plus sign or inverted cross.
- Generally, on there own Doji candlesticks are neutral and reflect very short-term market indecision.
- However, there are two particular types of Doji patterns, the Dragonfly Doji and the Gravestone Doji that provide stronger signals.
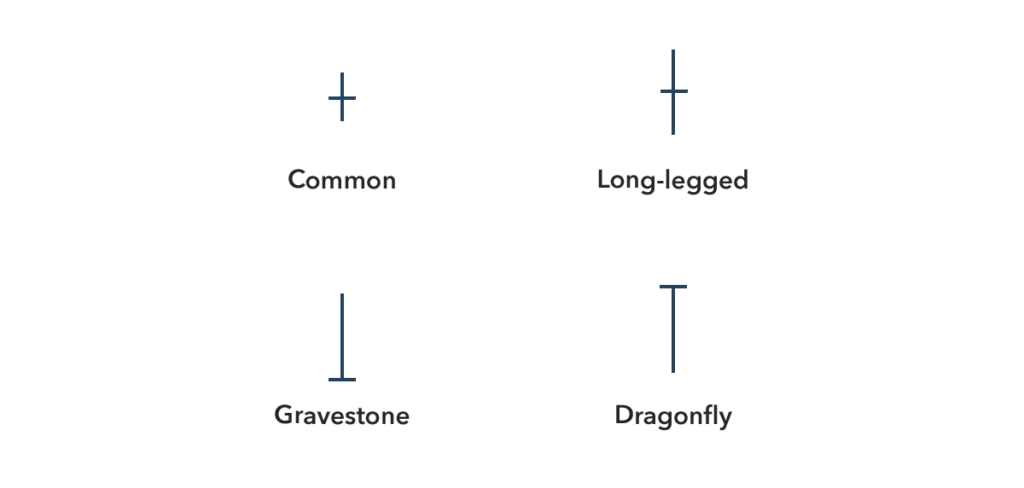
Dragonfly Doji Pattern
- The Dragonfly Doji pattern has an open and close that occur at or very close to the same price, producing a Doji.
- Significantly, however, a Dragonfly Doji pattern sees the open and close also at or very near to the high for the trading period.
- Therefore, there is a long lower shadow or tail, with practically no upper shadow or wick.
- The Dragonfly Doji pattern usually signals a shift to a bullish trend and is particularly powerful when seen during a downtrend.
- If the Dragonfly Doji pattern is seen in an uptrend, it could possibly signal a bearish trend reversal, but only if the price in the next 1-2 candlesticks moves below the low of the Dragonfly Doji pattern.
Gravestone Doji Pattern
- The Gravestone Doji pattern is really the opposite to the Dragonfly Doji pattern.
- The Gravestone Doji pattern has an open and close that occur at or very close to the same price, producing a Doji.
- Significantly, however, a Gravestone Doji pattern sees the open and close also at or very near to the low for the trading period.
- Therefore, there is a long upper shadow or wick, with practically no lower shadow or tail.
- The Gravestone Doji pattern usually signals a shift to a bearish trend and is particularly powerful when seen during an uptrend.
- If the Gravestone Doji pattern is seen in a downtrend, it could possibly signal a bullish trend reversal, but only if the price in the next 1-2 candlesticks moves above the high of the Dragonfly Doji pattern.
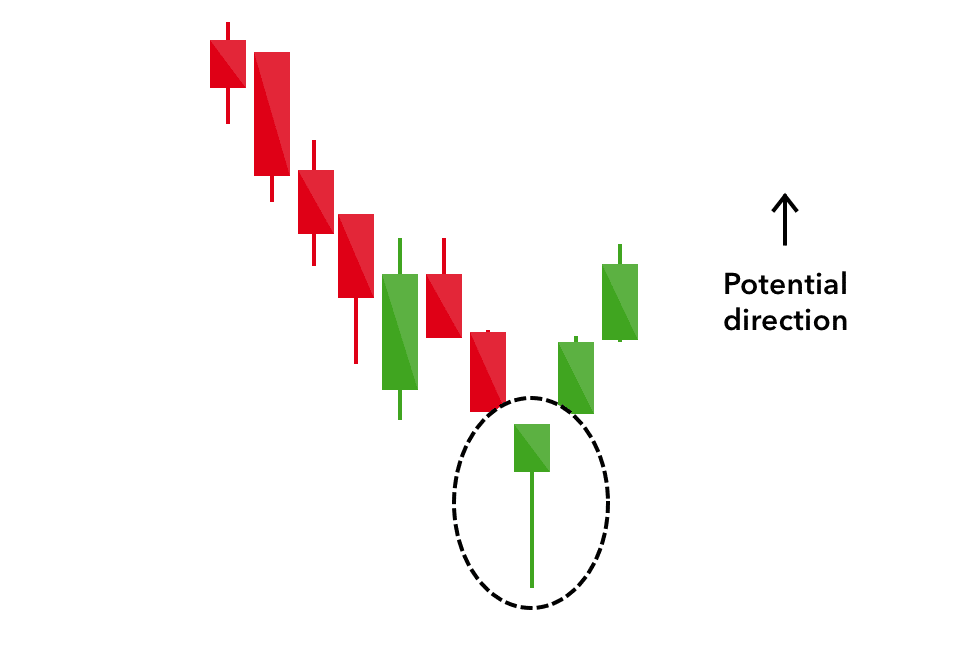
Hammer Pattern
- A Hammer candlestick occurs in a downtrend.
- It is formed when in a time period a market trades initially lower from the open, to then rebound back close to the higher opening level.
- The Hammer candlestick has a small real body, a long lower shadows (tail) and hardly any or no upper shadow (wick).
- The real body can be “up” or “down” (green or red).
- Usually you’d require the lower shadow to be at least twice the length of the body.
- If in the next candlestick the price moves up above the Hammer high, a bullish trend reversal is signalled.
Inverted Hammer Pattern
- An Inverted Hammer pattern occurs in a downtrend.
- It is formed when the price trades initially higher from the open, to then fail back lower and close near to the opening level.
- The Inverted Hammer candlestick has a small real body, a long upper shadows (wick) and hardly any or no lower shadow (tail).
- The real body can be “up” or “down” (green or red).
- Usually you’d require the upper shadow to be at least twice the length of the body.
- If in the next candlestick, price moves up above the Inverted Hammer high, a bullish trend reversal is signalled.

We’ve explored the different types of candlestick patterns that are in common use and the history of these patterns. This highlights how important these patterns are, that they are still being used after hundreds of years. Plus, Homma, the pioneer of the candlestick patterns was himself extremely successful, which is surely a reason to pay attention. We have also delved deeper into the more useful patterns that you should try to identify in your trading. To see a broader look at all types of chart patterns check out our article here.
