As a trader, one of the key concepts you must be aware of is trading ranges. You must be able to understand them and use as part of your technical analysis. This article will give an in depth review on trading ranges with examples making sure you understand them.
What is trading range?
Let us set this in a historical context, using Dow Theory as our first stop. Back in the late 19th Century, Charles Dow (who developed the Dow Jones Industrial Average), wrote a series of articles in the Wall Street Journal, highlighting differing aspects of markets and trading, which became the tenets of Dow Theory.
One of these, is that markets move in trends and there are three types of trend, upward, downward and sideways trends. The upward trend is characterised by a series of higher highs and higher lows, whilst the downward trend is comprised of lower lows and lower highs. The sideways trend, is when there is not any consistency in successive swing highs or swing lows, resulting in a more erratic, sideways movement. We would also call this a consolidation phase, a non-trend stage, or a trading range.
So, as a trader, you would usually probably look to identify trending markets and go with the trend, the market saying is after all, “the trend is your friend”.
But you could also look to identify when a market has entered into a trading range, and profit from trading in this environment.
How does a trading range work?
Here we are going to look at ways in which you can identify when a market you are looking to trade has entered into a trading range. And we can look at the steps you can take to implement a trading range strategy.
- First, decide that the market has moved from a trend to a non-trend, trading range. This is easiest done by simply looking at the market and identifying that it is no longer moving with a trending bias but has established upper and lower boundaries and is moving between these.
- So, you would look to establish range support levels (or areas) and range resistance levels (or areas).
- This would be done by looking at various failure highs and rebound lows that have been established during the formation of the trading range and identifying upper resistance zones and lower support zones.
- You would then look to enter short positions as the market moved up into the resistance area and look to enter long exposure as the market moved into the support area.
- Critical here, will be stop loss placement. Ideally, the stop loss would be placed above the top of the highest resistance peak when short, and below the lowest support low when long.
- It would be recommended that either a time, or probably more likely a price filter (or buffer) is used to decide how far above or below to place the stop. This should be decided upon beforehand, which would ideally be calculated and optimised by back-testing.
- Alongside the identification of the support and resistance areas to define where to enter the long and short positions respectively, it would also be useful to use a technical momentum indicator, to assist in the timing of trade entry. Ideally, it would be best to use a momentum oscillator that shows overbought and oversold conditions when trading in a range. The most commonly used momentum indicator for ranges is the Stochastic.
Having defined the process and steps by which we can identify the range and the trading tools used, lets now take a look at a trading range example and how we would look to benefit and profit from a trading range strategy.
Trading range example
Here we are going to look at a real trading range example and run through the main features of range trading, and how you could apply them in real scenario.
Let’s walk through our steps.
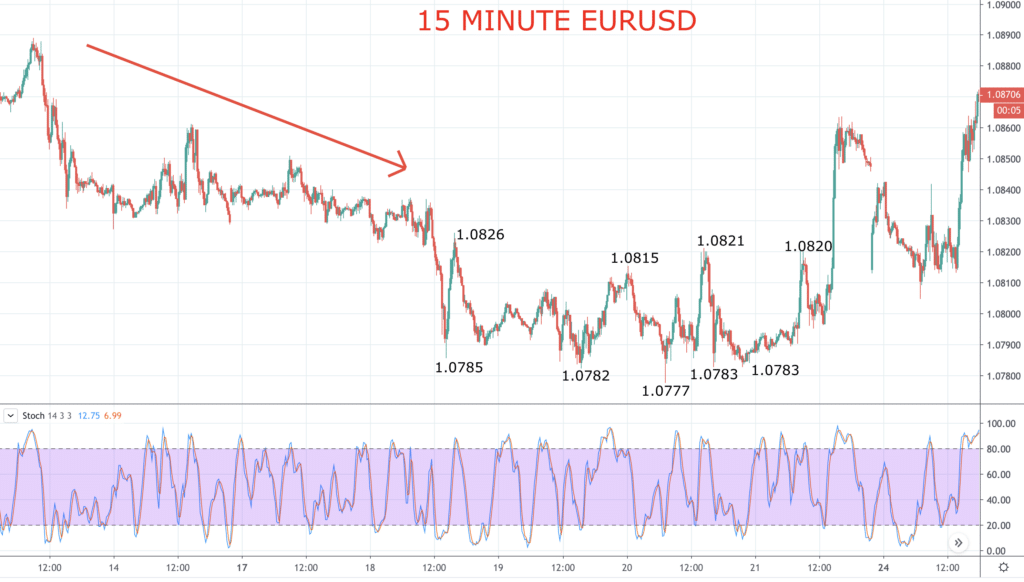
- The market has signalled a move from a down trend (indicated by the red down arrow) to a non-trend, trading range, when it failed to make a significant new downside extension below the 1.0785 low only moving to the 1.0782 low
- On the rebound and then setback from 1.0815, the market failed to overcome the swing peak at 1.0826,
- This then established a range support area at 1.0785/82 and range resistance area at 1.0815/26
- Subsequently, the strategy would have been to sell at the upper end of the range, towards 1.0815/26 and enter short positions and look to buy and enter long exposure towards 1.0785/82.
- Critical as we have stated is stop loss placement and this is very much a discretionary process, but let’s look at a potential example.
- In this example we would recommend a buffer to place the stop at least 50% of the trading range, above and below the peak of the resistance area and the bottom of the support area. This then allows for a Risk Reward Ratio of 2 to 1. This would be 50% of 1.0782 to 1.0826, so half of 24 pips, equalling 17 pips. However, various price (or time) filters can used to calculate the stop and as we have recommended, enhanced by experimentation and back-testing.
- Finally, employ the Stochastic to reinforce range trading decisions and entries. In the lower section of the chart, you can see on the occasions that the market moved into or close to our support and resistance zones, the Stochastic also entered oversold and overbought territory respectively. This would have reinforced the decisions to enter long and short positions.
In summary then, we have looked at what a trading range is and the steps that we can take to set up a range trading strategy. We wish you well in you trading range journey. For more information on trading ranges check out our article on trading channels.
