What is a rectangle pattern?
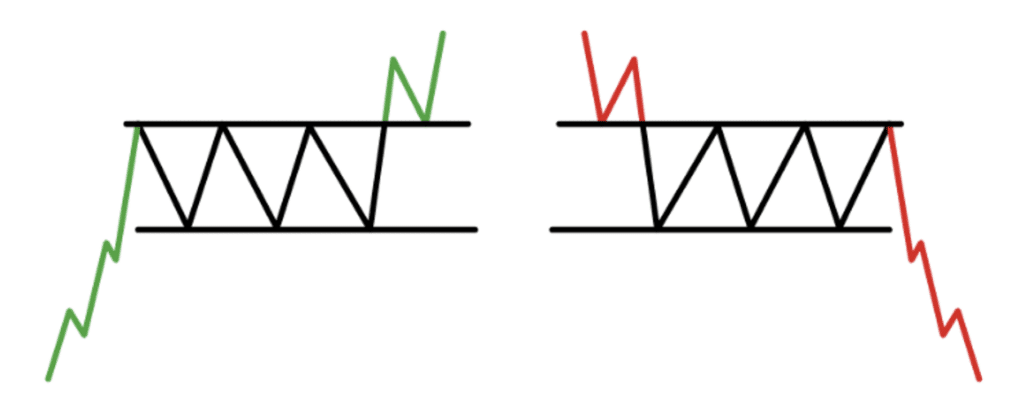
The rectangle is a consolidation pattern that signals a pause within a trend. The rectangle pattern develops between lines of horizontal support and resistance. However, importantly, they are seen as continuation patterns, with the pause coming before a breakout in the direction of the prevailing trend.
The opposite of a consolidation rectangle is a top or a bottom. Where a rectangle is seen as a continuation pattern, tops and bottoms are seen as reversal patterns.
The pattern formation
Here are a few features of the formation of a rectangle:
- The rectangle is a pause within a trend. So it needs a decisive trend coming into the pattern.
- The market then consolidates within horizontal lines of support and resistance that build up. Ideally, this would be at least three tests of the support and resistance.
- The market then posts a breakout in the direction of the prevailing trend.
There are various ways of trading a rectangle:
- Trade the consolidation. Traders taking the view that the rectangle will continue will look to buy around the rectangle lows and sell around the rectangle highs. If there is a confirmed break of the rectangle support or resistance this can signal an end to the consolidation and a new outlook has formed.
- Trade the breakout of the rectangle. A rectangle is a consolidation, with no decisive trend and often mixed signals. However, the breakout of a rectangle can generate a more decisive direction. This can generate implied targets and trading levels (see below).
A warning: always look for confirmation
It is important to not trade for a completed rectangle until the move has been confirmed. A rectangle could easily end up becoming a top or base pattern.
Using other indicators, such as momentum can indicate the direction of the breakout, but it is always safest to wait for the price to confirm a completed rectangle.
Implied targets, pullbacks and stop-losses
A completed rectangle pattern will generate key trading levels.
The pattern will give us an implied target, an expected potential area for a pullback and a stop-loss where the pattern is considered to have been aborted.
| Upside break | Implied target | The height of the rectangle is measured from the key support to the key resistance. This is projected higher from the breakout above the resistance |
| Pullback | Following the breakout, the old resistance becomes a new basis of support for a pullback. | |
| Stop-loss | A retracement lower, back into the old rectangle and a move below half of the pattern height. | |
| Downside break | Implied target | The depth of the rectangle is measured from the key resistance down to the key support. This is projected lower from the breakdown below the key support. |
| Pullback | Once the pattern is complete, the old support of the rectangle becomes new resistance. | |
| Stop-loss | A retracement higher, back into the old rectangle, with a move above half of the pattern depth. |
When is a rectangle not a rectangle? When it is a reversal.
The rectangle is considered to be a continuation pattern. Subsequently, if the rectangle formation ends up being a trend reversal then it is not a rectangle at all.
If the market consolidates in a rectangle following an uptrend, only for the market to break down, this would be a top reversal pattern. Similarly, if there is a consolidation rectangle after a downtrend that results in a break higher, this would be a base or bottom reversal pattern.
Essentially, it does not overly matter what the pattern is called. The principle of the implied projection, pullback and stop-loss remains the same:
- The implied target is still the height of the pattern projected from the breakout.
- The breakout point is still an area where a pullback can be expected to unwind to.
- The stop loss is still a move back through more than half of the pattern height.
Therefore, we can say that the opposite of a consolidation rectangle is a top/bottom reversal pattern.
